to download the complete report - GulfBase.com
to download the complete report - GulfBase.com
to download the complete report - GulfBase.com

You also want an ePaper? Increase the reach of your titles
YUMPU automatically turns print PDFs into web optimized ePapers that Google loves.
3060.SE (Reuters)<br />
YNCCO AB Equity (Bloomberg)<br />
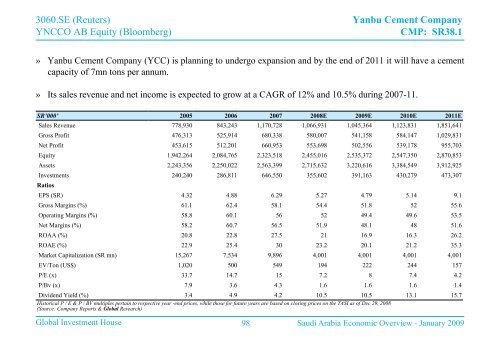
Yanbu Cement Company<br />
CMP: SR38.1<br />
» Yanbu Cement Company (YCC) is planning <strong>to</strong> undergo expansion and by <strong>the</strong> end of 2011 it will have a cement<br />
capacity of 7mn <strong>to</strong>ns per annum.<br />
» Its sales revenue and net in<strong>com</strong>e is expected <strong>to</strong> grow at a CAGR of 12% and 10.5% during 2007-11.<br />
SR’000’ 2005 2006 2007 2008E 2009E 2010E 2011E<br />
Sales Revenue 778,930 843,243 1,170,728 1,066,931 1,045,364 1,123,831 1,851,641<br />
Gross Profit 476,313 525,914 680,338 580,007 541,158 584,147 1,029,831<br />
Net Profit 453,615 512,201 660,953 553,698 502,556 539,178 955,703<br />
Equity 1,942,264 2,084,765 2,323,518 2,455,016 2,535,372 2,547,350 2,870,853<br />
Assets 2,243,356 2,250,022 2,563,399 2,715,632 3,220,616 3,384,549 3,912,925<br />
Investments 240,240 286,811 646,550 355,602 391,163 430,279 473,307<br />
Ratios<br />
EPS (SR) 4.32 4.88 6.29 5.27 4.79 5.14 9.1<br />
Gross Margins (%) 61.1 62.4 58.1 54.4 51.8 52 55.6<br />
Operating Margins (%) 58.8 60.1 56 52 49.4 49.6 53.5<br />
Net Margins (%) 58.2 60.7 56.5 51.9 48.1 48 51.6<br />
ROAA (%) 20.8 22.8 27.5 21 16.9 16.3 26.2<br />
ROAE (%) 22.9 25.4 30 23.2 20.1 21.2 35.3<br />
Market Capitalization (SR mn) 15,267 7,534 9,896 4,001 4,001 4,001 4,001<br />
EV/Ton (US$) 1,020 500 549 194 222 244 157<br />
P/E (x) 33.7 14.7 15 7.2 8 7.4 4.2<br />
P/Bv (x) 7.9 3.6 4.3 1.6 1.6 1.6 1.4<br />
Dividend Yield (%) 3.4 4.9 4.2 10.5 10.5 13.1 15.7<br />
His<strong>to</strong>rical P / E & P / BV multiples pertain <strong>to</strong> respective year -end prices, while those for future years are based on closing prices on <strong>the</strong> TASI as of Dec 29, 2008<br />
(Source: Company Reports & Global Research)<br />
Global Investment House 98 Saudi Arabia Economic Overview - January 2009