to download the complete report - GulfBase.com
to download the complete report - GulfBase.com
to download the complete report - GulfBase.com

Create successful ePaper yourself
Turn your PDF publications into a flip-book with our unique Google optimized e-Paper software.
2290.SE (Reuters)<br />
YANSAB AB Equity (Bloomberg)<br />
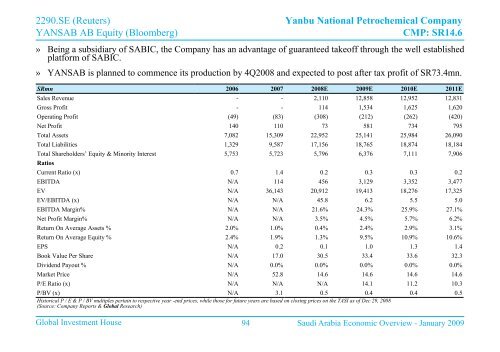
Yanbu National Petrochemical Company<br />
CMP: SR14.6<br />
» Being a subsidiary of SABIC, <strong>the</strong> Company has an advantage of guaranteed takeoff through <strong>the</strong> well established<br />
platform of SABIC.<br />
» YANSAB is planned <strong>to</strong> <strong>com</strong>mence its production by 4Q2008 and expected <strong>to</strong> post after tax profit of SR73.4mn.<br />
SRmn 2006 2007 2008E 2009E 2010E 2011E<br />
Sales Revenue - - 2,110 12,858 12,952 12,831<br />
Gross Profit - - 114 1,534 1,625 1,620<br />
Operating Profit (49) (83) (308) (212) (262) (420)<br />
Net Profit 140 110 73 581 734 795<br />
Total Assets 7,082 15,309 22,952 25,141 25,984 26,090<br />
Total Liabilities 1,329 9,587 17,156 18,765 18,874 18,184<br />
Total Shareholders’ Equity & Minority Interest 5,753 5,723 5,796 6,376 7,111 7,906<br />
Ratios<br />
Current Ratio (x) 0.7 1.4 0.2 0.3 0.3 0.2<br />
EBITDA N/A 114 456 3,129 3,352 3,477<br />
EV N/A 36,143 20,912 19,413 18,276 17,325<br />
EV/EBITDA (x) N/A N/A 45.8 6.2 5.5 5.0<br />
EBITDA Margin% N/A N/A 21.6% 24.3% 25.9% 27.1%<br />
Net Profit Margin% N/A N/A 3.5% 4.5% 5.7% 6.2%<br />
Return On Average Assets % 2.0% 1.0% 0.4% 2.4% 2.9% 3.1%<br />
Return On Average Equity % 2.4% 1.9% 1.3% 9.5% 10.9% 10.6%<br />
EPS N/A 0.2 0.1 1.0 1.3 1.4<br />
Book Value Per Share N/A 17.0 30.5 33.4 33.6 32.3<br />
Dividend Payout % N/A 0.0% 0.0% 0.0% 0.0% 0.0%<br />
Market Price N/A 52.8 14.6 14.6 14.6 14.6<br />
P/E Ratio (x) N/A N/A N/A 14.1 11.2 10.3<br />
P/BV (x) N/A 3.1 0.5 0.4 0.4 0.5<br />
His<strong>to</strong>rical P / E & P / BV multiples pertain <strong>to</strong> respective year -end prices, while those for future years are based on closing prices on <strong>the</strong> TASI as of Dec 29, 2008<br />
(Source: Company Reports & Global Research)<br />
Global Investment House 94 Saudi Arabia Economic Overview - January 2009