to download the complete report - GulfBase.com
to download the complete report - GulfBase.com
to download the complete report - GulfBase.com

You also want an ePaper? Increase the reach of your titles
YUMPU automatically turns print PDFs into web optimized ePapers that Google loves.
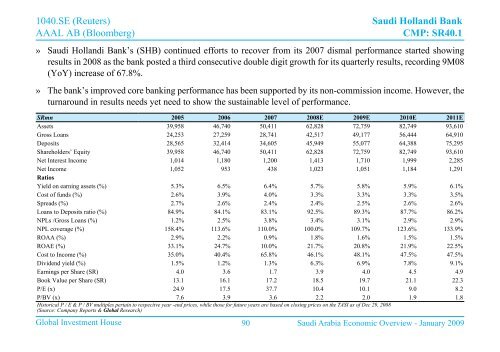
1040.SE (Reuters)<br />
AAAL AB (Bloomberg)<br />
Saudi Hollandi Bank<br />
CMP: SR40.1<br />
» Saudi Hollandi Bank’s (SHB) continued efforts <strong>to</strong> recover from its 2007 dismal performance started showing<br />
results in 2008 as <strong>the</strong> bank posted a third consecutive double digit growth for its quarterly results, recording 9M08<br />
(YoY) increase of 67.8%.<br />
» The bank’s improved core banking performance has been supported by its non-<strong>com</strong>mission in<strong>com</strong>e. However, <strong>the</strong><br />
turnaround in results needs yet need <strong>to</strong> show <strong>the</strong> sustainable level of performance.<br />
SRmn 2005 2006 2007 2008E 2009E 2010E 2011E<br />
Assets 39,958 46,740 50,411 62,828 72,759 82,749 93,610<br />
Gross Loans 24,253 27,259 28,741 42,517 49,177 56,444 64,910<br />
Deposits 28,565 32,414 34,605 45,949 55,077 64,388 75,295<br />
Shareholders’ Equity 39,958 46,740 50,411 62,828 72,759 82,749 93,610<br />
Net Interest In<strong>com</strong>e 1,014 1,180 1,200 1,413 1,710 1,999 2,285<br />
Net In<strong>com</strong>e 1,052 953 438 1,023 1,051 1,184 1,291<br />
Ratios<br />
Yield on earning assets (%) 5.3% 6.5% 6.4% 5.7% 5.8% 5.9% 6.1%<br />
Cost of funds (%) 2.6% 3.9% 4.0% 3.3% 3.3% 3.3% 3.5%<br />
Spreads (%) 2.7% 2.6% 2.4% 2.4% 2.5% 2.6% 2.6%<br />
Loans <strong>to</strong> Deposits ratio (%) 84.9% 84.1% 83.1% 92.5% 89.3% 87.7% 86.2%<br />
NPLs /Gross Loans (%) 1.2% 2.5% 3.8% 3.4% 3.1% 2.9% 2.9%<br />
NPL coverage (%) 158.4% 113.6% 110.0% 100.0% 109.7% 123.6% 133.9%<br />
ROAA (%) 2.9% 2.2% 0.9% 1.8% 1.6% 1.5% 1.5%<br />
ROAE (%) 33.1% 24.7% 10.0% 21.7% 20.8% 21.9% 22.5%<br />
Cost <strong>to</strong> In<strong>com</strong>e (%) 35.0% 40.4% 65.8% 46.1% 48.1% 47.5% 47.5%<br />
Dividend yield (%) 1.5% 1.2% 1.3% 6.3% 6.9% 7.8% 9.1%<br />
Earnings per Share (SR) 4.0 3.6 1.7 3.9 4.0 4.5 4.9<br />
Book Value per Share (SR) 13.1 16.1 17.2 18.5 19.7 21.1 22.3<br />
P/E (x) 24.9 17.5 37.7 10.4 10.1 9.0 8.2<br />
P/BV (x) 7.6 3.9 3.6 2.2 2.0 1.9 1.8<br />
His<strong>to</strong>rical P / E & P / BV multiples pertain <strong>to</strong> respecitve year -end prices, while those for future years are based on closing prices on <strong>the</strong> TASI as of Dec 29, 2008<br />
(Source: Company Reports & Global Research)<br />
Global Investment House 90 Saudi Arabia Economic Overview - January 2009