Native Habitat Inventory Final Report 2004 - St. Lucie County
Native Habitat Inventory Final Report 2004 - St. Lucie County
Native Habitat Inventory Final Report 2004 - St. Lucie County

Create successful ePaper yourself
Turn your PDF publications into a flip-book with our unique Google optimized e-Paper software.
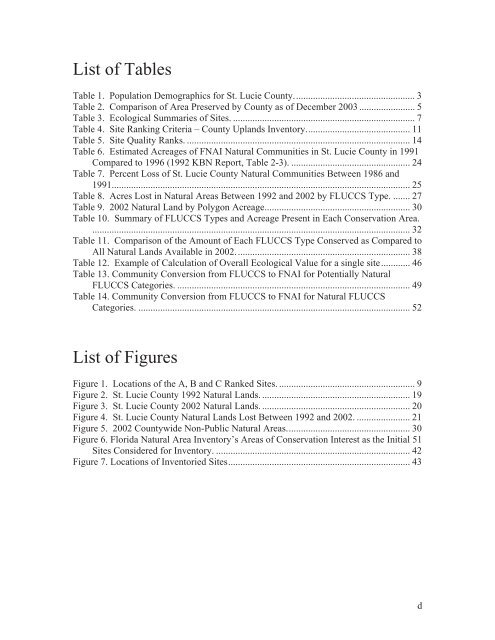
List of Tables<br />
Table 1. Population Demographics for <strong>St</strong>. <strong>Lucie</strong> <strong>County</strong>. ................................................. 3<br />
Table 2. Comparison of Area Preserved by <strong>County</strong> as of December 2003 ....................... 5<br />
Table 3. Ecological Summaries of Sites. ........................................................................... 7<br />
Table 4. Site Ranking Criteria – <strong>County</strong> Uplands <strong>Inventory</strong>. .......................................... 11<br />
Table 5. Site Quality Ranks. ............................................................................................ 14<br />
Table 6. Estimated Acreages of FNAI Natural Communities in <strong>St</strong>. <strong>Lucie</strong> <strong>County</strong> in 1991<br />
Compared to 1996 (1992 KBN <strong>Report</strong>, Table 2-3). ................................................. 24<br />
Table 7. Percent Loss of <strong>St</strong>. <strong>Lucie</strong> <strong>County</strong> Natural Communities Between 1986 and<br />
1991........................................................................................................................... 25<br />
Table 8. Acres Lost in Natural Areas Between 1992 and 2002 by FLUCCS Type. ....... 27<br />
Table 9. 2002 Natural Land by Polygon Acreage. ........................................................... 30<br />
Table 10. Summary of FLUCCS Types and Acreage Present in Each Conservation Area.<br />
................................................................................................................................... 32<br />
Table 11. Comparison of the Amount of Each FLUCCS Type Conserved as Compared to<br />
All Natural Lands Available in 2002. ....................................................................... 38<br />
Table 12. Example of Calculation of Overall Ecological Value for a single site ............ 46<br />
Table 13. Community Conversion from FLUCCS to FNAI for Potentially Natural<br />
FLUCCS Categories. ................................................................................................ 49<br />
Table 14. Community Conversion from FLUCCS to FNAI for Natural FLUCCS<br />
Categories. ................................................................................................................ 52<br />
List of Figures<br />
Figure 1. Locations of the A, B and C Ranked Sites. ........................................................ 9<br />
Figure 2. <strong>St</strong>. <strong>Lucie</strong> <strong>County</strong> 1992 Natural Lands. ............................................................. 19<br />
Figure 3. <strong>St</strong>. <strong>Lucie</strong> <strong>County</strong> 2002 Natural Lands. ............................................................. 20<br />
Figure 4. <strong>St</strong>. <strong>Lucie</strong> <strong>County</strong> Natural Lands Lost Between 1992 and 2002. ...................... 21<br />
Figure 5. 2002 <strong>County</strong>wide Non-Public Natural Areas. .................................................. 30<br />
Figure 6. Florida Natural Area <strong>Inventory</strong>’s Areas of Conservation Interest as the Initial 51<br />
Sites Considered for <strong>Inventory</strong>. ................................................................................ 42<br />
Figure 7. Locations of Inventoried Sites ........................................................................... 43<br />
d