- Page 2 and 3:
IEDC 2010 Proceedings of the Third
- Page 4 and 5:
CONTENTS Preface Conference Committ
- Page 6 and 7:
IEDC-231-023 2.3 Transportation net
- Page 8 and 9:
PREFACE Over the last decade, issue
- Page 10 and 11:
1. Mr. Afzal Ahmed Lecturer, Depart
- Page 12:
Surname Forenames E-mail Address Pa
- Page 15 and 16:
Spaceborne Remote Sensing Data for
- Page 17 and 18:
1.3 Karachi Metropolitan Transporta
- Page 19 and 20:
3. Travel Demand Modeling and Daily
- Page 21 and 22:
AADT , veh/day traffic count sites.
- Page 23 and 24:
operating cost is 19-24 cents per v
- Page 25 and 26:
Prioritizing Environmental Infrastr
- Page 27 and 28:
The rapid growth of Punjab's cities
- Page 29 and 30:
In Table 1 the BOD estimates have b
- Page 31 and 32:
The results clearly indicate that i
- Page 33 and 34:
An Intelligent Drainage System to P
- Page 35 and 36:
level. The situation caused objecti
- Page 37 and 38:
4.3 Electro-mechanical system requi
- Page 39 and 40:
Contribution of NED University in E
- Page 41 and 42:
were felt in some areas of Pakistan
- Page 43 and 44:
the USA and held meetings with the
- Page 45 and 46:
Figure 4. Demand response spectrum
- Page 47 and 48:
3.4 Vertical deformation near Karac
- Page 49 and 50:
Earthquake Performance of RC Struct
- Page 51 and 52:
Inadequate code implementation; Ina
- Page 53 and 54:
(a) (b) (c) Figure 2. Unsymmetrical
- Page 55 and 56:
(a) (b) Figure 5. Construction of o
- Page 57 and 58:
(a) (b) Figure 8. Splicing of colum
- Page 59:
Lin, J.H. (2005). ―Evaluation of
- Page 62 and 63:
Persons (Human) induced disaster is
- Page 64 and 65:
and non human resources to protect
- Page 66 and 67:
In case of major events and disaste
- Page 68 and 69:
3.2.1 Aims and Objectives of DMP at
- Page 70 and 71:
- Manmade disasters. 3.3 Practical
- Page 72 and 73:
c. Students Information Block. d. S
- Page 74 and 75:
- Seek assistance from University a
- Page 76 and 77:
Pearce, Laurie; Hightower, Henry, K
- Page 78 and 79:
If the location of the charge weigh
- Page 80 and 81:
Exterior Columns: These are designe
- Page 82 and 83:
If Pso is the pressure in the regul
- Page 84 and 85:
Height of Structure (H s ) (m) Tabl
- Page 86 and 87:
6. Conclusions Following conclusion
- Page 88 and 89:
agencies. It shares 65% of the tota
- Page 90 and 91:
2.2 Soils and Landforms Different l
- Page 92 and 93:
2.4 Land Capability Eight (8) class
- Page 94 and 95:
Northing (m) 3.2 Water Quality The
- Page 96 and 97:
Ejaz, M. S. & Bhatti, H. A. (2007).
- Page 98 and 99:
esearch, a semi-automated data surv
- Page 100 and 101:
database contain the picture code,
- Page 102 and 103:
imposes the erroneous data. During
- Page 104 and 105:
Aggregate Characterization - A Gate
- Page 106 and 107:
2.1 Aggregate Characterization Aggr
- Page 108 and 109:
Table 2. Engineering Test Results a
- Page 110 and 111:
and Tighe, 2004). The databases for
- Page 112 and 113:
the development of a comprehensive
- Page 114 and 115:
Satellite Image from Google Earth S
- Page 116 and 117:
Evaluation of Driving Comfort and S
- Page 118 and 119:
mobile station, and the satellite d
- Page 120 and 121:
PSD((m/s 2 ) 2 /Hz) PSD((m/s 2 ) 2
- Page 122 and 123:
The simulation data during travelin
- Page 124 and 125:
Yaw rate RMS(deg/s) Steering angle
- Page 126 and 127:
SUSTAINABLE TRANSPORTATION AND ENVI
- Page 128 and 129:
great centre of learning, knowledge
- Page 130 and 131:
2.2 Urban Development Plans - After
- Page 132 and 133:
The proposed alignment was made acc
- Page 134 and 135:
have enriched the Ring Road proposa
- Page 136 and 137:
project were completed under Lahore
- Page 138 and 139:
Therefore, the Ring Road or ‗Sout
- Page 140 and 141:
For the Ring Road, CSTS estimated n
- Page 142 and 143:
Government of Pakistan, Planning Co
- Page 144 and 145:
Traffic Management, A Social Concer
- Page 146 and 147:
5. Magnitude of problems encompassi
- Page 148 and 149:
SO 2 (10 -6 ) 44 38 - NO 2 (10 -9 )
- Page 150 and 151:
action. Movement through the levels
- Page 152 and 153:
STMS Government Society Figure 2. S
- Page 154 and 155:
Development of Guidelines for Road
- Page 156 and 157:
Through secondary safety measures,
- Page 158 and 159:
and fatal injuries while road users
- Page 160 and 161:
The ending portion of Shahrah-e-usm
- Page 162 and 163:
Again this example is good for bett
- Page 164 and 165:
Environmental Impacts of Road Trans
- Page 166 and 167:
Lagos was the capital of Nigeria un
- Page 168 and 169:
Table 1. Areal Extents of the Landu
- Page 170 and 171:
Figure 4. Point Based Features alon
- Page 172 and 173:
Chokor B. A. and Odemerho F.O. (199
- Page 174 and 175:
ecause of complexities and connecti
- Page 176 and 177:
Number of accident Year of accident
- Page 178 and 179:
clarified that about 75% of the cri
- Page 180 and 181:
elative frequency Figure 10- map of
- Page 182 and 183:
elative frequency Most accidents ha
- Page 184 and 185:
Economic Evaluation of Road Traffic
- Page 186 and 187:
4.3 Human Consequences An accident
- Page 188 and 189:
Table 1. Descriptive Statistics for
- Page 190 and 191:
comes to 30% whereas a small share
- Page 192 and 193:
Accidents Reduction (%) CBR 1.80 15
- Page 194 and 195:
Accident Prediction Linear Model fo
- Page 196 and 197:
About 15% of the drivers are owners
- Page 198 and 199:
Accidents in last two years Acciden
- Page 200 and 201:
Presence Of Cassette Player, Yes .0
- Page 202 and 203:
An Evaluation of Future Travel Patt
- Page 204 and 205:
infrastructure, public transport, a
- Page 206 and 207:
Table 2. Present OD Matrix Used in
- Page 208 and 209:
RMS(Root Mean Square) error rate Ro
- Page 210 and 211:
4. Results and Discussions In trans
- Page 212 and 213:
The highest LOS we come across was
- Page 214 and 215:
Abstract A Model for Travel Decisio
- Page 216 and 217:
2.1 Household description and its t
- Page 218 and 219:
individuals when faced same set of
- Page 220 and 221:
Change in Consumption Stock Need Ac
- Page 222 and 223:
Table 1 depicted that in almost all
- Page 224 and 225:
6. Conclusion The research reported
- Page 226 and 227:
Design of Stated Preference Experim
- Page 228 and 229:
travellers and what are the determi
- Page 230 and 231:
2.3 Choice of Modelling Framework A
- Page 232 and 233:
unattractive. The scenario hence fo
- Page 234 and 235:
4.2 Simulation Test The SP design w
- Page 236 and 237:
framework, particularly with regard
- Page 238 and 239:
Assessing the Implementation of Raw
- Page 240 and 241:
Figure 1. Master Plan of Rawalpindi
- Page 242 and 243:
does not give a holistic view of th
- Page 244 and 245:
Figure 7. Guided Development Plan o
- Page 246 and 247:
Below is a comparison of the estima
- Page 248 and 249:
Urban Design and Integrated Transpo
- Page 250 and 251:
empower local communities with easy
- Page 252 and 253:
Figure 1. Traditional Planning Appr
- Page 254 and 255:
trends of sprawls and constant addi
- Page 256 and 257:
7. Comprehensive Transport Artery S
- Page 258 and 259:
9. Conclusion Integrated transport
- Page 260 and 261:
Solving Transportation Network Desi
- Page 262 and 263:
that stochastic user equilibrium ba
- Page 264 and 265:
E x x 0 = a E x x 5 a a a 0 2 1 F 0
- Page 266 and 267:
4. Experimental Results Using the n
- Page 268 and 269:
that if a truncated density f x x 0
- Page 270 and 271:
Streamling of Road Safety Asghar Ab
- Page 272 and 273:
3.1 Statistics Table 1 Accident Loc
- Page 274 and 275:
The secondary signals provide motor
- Page 276 and 277:
S S P P P S P P P S S S ANNEX-A EXI
- Page 278 and 279:
Urban Transportation Policy Framewo
- Page 280 and 281:
of Karachi. In this regard, major d
- Page 282 and 283:
Table 2. Urgency Indices of Strateg
- Page 284 and 285:
4. Urban Transportation Policy Fram
- Page 286 and 287:
Urban Public Transport Problems for
- Page 288 and 289:
There‘s been an absolutely fantas
- Page 290 and 291:
6. Social and Behavioral Problems S
- Page 292 and 293:
Determination of Efficient Fare and
- Page 294 and 295:
2). All the gathered knowledge and
- Page 296 and 297:
Figure 3. Relationship between Cost
- Page 298 and 299:
practice as a hazard to the users.
- Page 300 and 301:
Table 6. Adjustments for Bus Recove
- Page 302 and 303:
Public Opinion towards Public Priva
- Page 304 and 305:
esidential area, income etc. The fi
- Page 306 and 307:
Table 2. Ageing of the Bus Fleet Ag
- Page 308 and 309:
6.1 Quality were from Shah faisal t
- Page 310 and 311:
facilitated through private public
- Page 312 and 313:
ITS Modeling and Analysis
- Page 314 and 315: mostly highways or main arterials,
- Page 316 and 317: of the link. If they are not on the
- Page 318 and 319: Further more, 144 intersection node
- Page 320 and 321: Therefore, interval of 07:00 AM - 0
- Page 322 and 323: They methods proposed in this study
- Page 324 and 325: the method used for estimation of t
- Page 326 and 327: 1 ( * T a T ) [ln( v f ) ( ) ] [ 1
- Page 328 and 329: speed(km/h) speed(km/h) p cr (veh/k
- Page 330 and 331: v f (km/h) p cr (veh/km/lane) a z l
- Page 332 and 333: speed(km/h) a 2.5 exponent exponent
- Page 334 and 335: Free-flow Travel time on the link T
- Page 336 and 337: This says that travel time is equal
- Page 338 and 339: The following paragraphs discuss th
- Page 340 and 341: Therefore, the first two terms in t
- Page 342 and 343: profile obtained for the Point-Queu
- Page 344 and 345: Figure 5. 3 rd Case Travel time and
- Page 346 and 347: Mun, J.-S.(2007), ―Traffic Perfor
- Page 348 and 349: Activity-Based Trip Generation Mode
- Page 350 and 351: area and parking area of a park, to
- Page 352 and 353: educational activities are prominen
- Page 354 and 355: inferred from the above results tha
- Page 356 and 357: negative effect over the choice of
- Page 358 and 359: Dependant Variable trips (employed
- Page 360 and 361: 1000 126000 0 20000 20 1 0 0 0 1 15
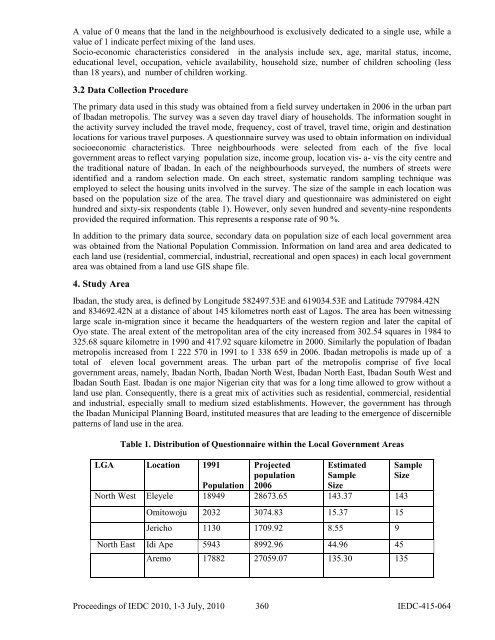
- Page 362 and 363: Relationship between Land Use and T
- Page 366 and 367: Onipepeye 1092 1652.42 8.26 8 South
- Page 368 and 369: Table 3. Correlation Coefficients b
- Page 370 and 371: of transport planning into urban pl
- Page 372 and 373: Standardising Transport Infrastruct
- Page 374 and 375: Systematic and integrated road side
- Page 376 and 377: 4. Description of the Manual Standa
- Page 378 and 379: 4.4 Utility Corridor Utility corrid
- Page 380 and 381: Punjab. The manual also provides gu
- Page 382 and 383: designers and other practitioners a
- Page 384 and 385: Master Plan 2020; Secondly there is
- Page 386 and 387: corridor and completed the project
- Page 388 and 389: 9. Evaluation of Signal Free Corrid
- Page 390 and 391: Causes Table 2. Comparison of Accid
- Page 392 and 393: Software Architecture of a Distribu
- Page 394 and 395: from one site mixed to or confused
- Page 396 and 397: Figure 4. DDCS as a distributed too
- Page 398 and 399: Table 1. DDCS Reliability Evaluatio
- Page 400 and 401: environment was better comparativel
- Page 402 and 403: Role of GIS in RTA Analysis : A Cas
- Page 404 and 405: Table 1. Feature Layers Used for RT
- Page 406 and 407: micro details i.e. local level info
- Page 408 and 409: overall influence of RTA incidents
- Page 410 and 411: The change detection in the Road Tr
- Page 412 and 413: GIS Based Placement and Route Plann
- Page 414 and 415:
fatal road accidents in Missouri, w
- Page 416 and 417:
Figure 2. Spatial distribution of E
- Page 418 and 419:
so may be more travel time covered
- Page 420 and 421:
Table 3. Shows the Mode of Arrival
- Page 422 and 423:
100% 90% 80% 543 42 9 11 70% 60% 86
- Page 424 and 425:
Abstract Role of Traffic Network in
- Page 426 and 427:
1.2 Efficiency of GIS for Policing
- Page 428 and 429:
2.1.4.6 Thematic mapping of Geograp
- Page 430 and 431:
4.2 Spatial distribution of crimina
- Page 432 and 433:
5. Conclusion This study establishe