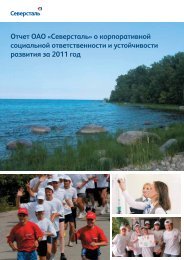
Annual Report 2007 - Severstal
Annual Report 2007 - Severstal
Annual Report 2007 - Severstal

Create successful ePaper yourself
Turn your PDF publications into a flip-book with our unique Google optimized e-Paper software.
OAO <strong>Severstal</strong> and subsidiaries<br />
Notes to the consolidated financial statements<br />
for the year ended December 31, <strong>2007</strong><br />
(Amounts expressed in thousands of US dollars, except as otherwise stated)<br />
31. Segment information<br />
Segmental income statements for the year ended December 31, <strong>2007</strong>:<br />
Russian <strong>Severstal</strong> Inter<br />
Mining Steel Lucchini North Metalware Financing segment<br />
segment segment segment America IPM segment segment transactions Consolidated<br />
Sales<br />
Sales – external 1,029,407 6,690,697 3,624,913 1,691,818 550,715 955,493 – – 14,543,043<br />
Sales – to related parties 1,167,458 1,278,328 131,595 53 – 56,216 – (1,931,782) 701,868<br />
2,196,865 7,969,025 3,756,508 1,691,871 550,715 1,011,709 – (1,931,782) 15,244,911<br />
Cost of sales (1,497,487) (4,837,325) (3,194,377) (1,664,065) (379,824) (871,799) – 1,903,306 (10,541,571)<br />
Gross profit 699,378 3,131,700 562,131 27,806 170,891 139,910 – (28,476) 4,703,340<br />
General and<br />
administrative expenses (149,755) (279,485) (188,016) (30,626) (9,509) (37,030) – 3,211 (691,210)<br />
Distribution expenses (180,788) (542,904) (117,998) – (29,075) (44,341) – 5,596 (909,510)<br />
Indirect taxes and contributions (64,964) (46,763) (32,188) – (4,440) (5,259) – – (153,614)<br />
Share of associates’ (losses)/profits – (95,637) (548) 5,338 – 1,450 – – (89,397)<br />
Net income from securities<br />
operations 33 21,164 10,827 – – 22 – (6,482) 25,564<br />
(Loss)/gain on disposal of<br />
property, plant and equipment (12,219) (31,799) (508) (3,485) (53) 12,283 – 501 (35,280)<br />
Net other operating<br />
(expenses)/income (9,912) 8,815 (17,343) 2,556 (692) 8,857 – 199 (7,520)<br />
Profit from operations 281,773 2,165,091 216,357 1,589 127,122 75,892 – (25,451) 2,842,373<br />
Impairment of property,<br />
plant and equipment (3,058) (5,451) (15,895) – – (4,705) – – (29,109)<br />
Negative goodwill, net 11,599 – 507 – – 117 – – 12,223<br />
Net other non-operating<br />
(expenses)/income (20,608) (39,178) 24,374 – (18) (2,828) – (20,318) (58,576)<br />
Profit before financing<br />
and taxation 269,706 2,120,462 225,343 1,589 127,104 68,476 – (45,769) 2,766,911<br />
Interest income 10,996 182,619 21,978 855 45 823 – (44,379) 172,937<br />
Interest expense (70,339) (124,870) (72,793) (12,418) (27,601) (7,649) – 27,377 (288,293)<br />
Foreign exchange difference (3,447) 10,544 (535) – (2,850) (1,096) – 284 2,900<br />
Profit before income tax 206,916 2,188,755 173,993 (9,974) 96,698 60,554 – (62,487) 2,654,455<br />
Income tax (expense)/benefit (45,684) (540,509) (64,808) 9,247 (20,080) (22,312) – 2,877 (681,269)<br />
Profit from continuing<br />
operations 161,232 1,648,246 109,185 (727) 76,618 38,242 – (59,610) 1,973,186<br />
Profit/(loss) from<br />
discontinued operations – – (15,660) – – – 16,093 – 433<br />
Profit for the year 161,232 1,648,246 93,525 (727) 76,618 38,242 16,093 (59,610) 1,973,619<br />
Additional information:<br />
Depreciation expense 203,409 332,536 196,569 14,492 23,370 23,712 – – 794,088<br />
Capital expenditures 394,047 494,780 199,267 483,342 23,335 29,965 – – 1,624,736<br />
Intersegment sales<br />
(incl. in sales to related parties) 1,142,654 647,880 131,595 – – 9,653 – (1,931,782) –<br />
<strong>Severstal</strong> <strong>Annual</strong> <strong>Report</strong> <strong>2007</strong> 105