Nu Skin 2010 Annual Report - Direct Selling News
Nu Skin 2010 Annual Report - Direct Selling News
Nu Skin 2010 Annual Report - Direct Selling News

You also want an ePaper? Increase the reach of your titles
YUMPU automatically turns print PDFs into web optimized ePapers that Google loves.
opportunity that will attract new distributors. We have also developed,<br />
and continue to promote in many of our markets, product subscription<br />
and loyalty programs that provide incentives for customers<br />
to commit to purchase a specific amount of products on a monthly<br />
basis. We believe these subscription programs have improved customer<br />
retention, have had a stabilizing impact on revenue, and have<br />
helped generate recurring sales for our distributors. Subscription orders<br />
represented 54% of our revenue in <strong>2010</strong>.<br />
Global economic conditions continue to be challenging in many<br />
of our markets. Although the economy appears to be recovering, it is<br />
not possible for us to predict the extent and timing of any improvement<br />
in global economic conditions. Despite difficult economic conditions,<br />
we experienced healthy growth in <strong>2010</strong>. We believe we have<br />
benefited from the nature of our distribution model and strong execution<br />
around a demonstrative product/opportunity initiative, which<br />
has helped offset to some degree the impact of weaker consumer<br />
spending. As a direct selling company, we offer a direct selling opportunity<br />
that allows an individual to supplement his/her income by<br />
selling our products and building a sales organization to market and<br />
sell our products. As the economy and the labor market decline, we<br />
find that there can be an increase in the number of people interested<br />
in becoming distributors in order to supplement their income. We<br />
believe that this increase in interest in our direct selling opportunity<br />
coupled with the strong marketing position of our new ageLOC antiaging<br />
products and our other products and tools have helped us to<br />
continue growing our business in these difficult economic conditions.<br />
However, if the economic problems are prolonged or worsen, we expect<br />
that we could see a negative impact on our business as distributors<br />
may have a more difficult time selling products and finding new<br />
customers.<br />
Our business is subject to various laws and regulations globally,<br />
particularly with respect to network marketing activities, cosmetics,<br />
and nutritional supplements. Accordingly, we face certain risks, including<br />
any improper claims or activities of our distributors or any inability<br />
to obtain or maintain necessary product registrations. For example,<br />
we continue to experience heightened regulatory and media<br />
scrutiny of the direct selling industry in Japan. Several direct sellers in<br />
Japan have been penalized for actions of distributors that violated<br />
applicable regulations. We could face similar penalties if we are unable<br />
to effectively manage the activities of our distributors<br />
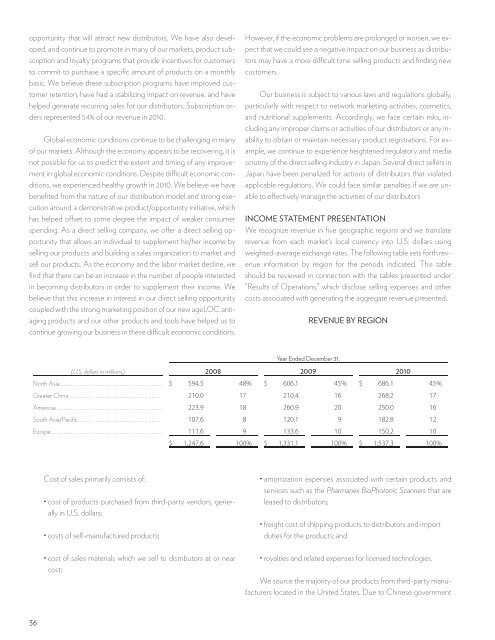
INCOME STATEMENT PRESENTATION<br />
We recognize revenue in five geographic regions and we translate<br />
revenue from each market’s local currency into U.S. dollars using<br />
weighted-average exchange rates. The following table sets forth revenue<br />
information by region for the periods indicated. This table<br />
should be reviewed in connection with the tables presented under<br />
“Results of Operations,” which disclose selling expenses and other<br />
costs associated with generating the aggregate revenue presented.<br />
REVENUE BY REGION<br />
Year Ended December 31,<br />
(U.S. dollars in millions) 2008 2009 <strong>2010</strong><br />
North Asia . . . . . . . . . . . . . . . . . . . . . . . . . . . . . . . . . . . . . . . . . . . . . . $ 594.5 48% $ 606.1 45% $ 686.1 45%<br />
Greater China . . . . . . . . . . . . . . . . . . . . . . . . . . . . . . . . . . . . . . . . . 210.0 17 210.4 16 268.2 17<br />
Americas . . . . . . . . . . . . . . . . . . . . . . . . . . . . . . . . . . . . . . . . . . . . . . . 223.9 18 260.9 20 250.0 16<br />
South Asia/Pacific . . . . . . . . . . . . . . . . . . . . . . . . . . . . . . . . . . . . . 107.6 8 120.1 9 182.8 12<br />
Europe . . . . . . . . . . . . . . . . . . . . . . . . . . . . . . . . . . . . . . . . . . . . . . . . . . 111.6 9 133.6 10 150.2 10<br />
$ 1,247.6 100% $ 1,331.1 100% $ 1,537.3 100%<br />
Cost of sales primarily consists of:<br />
• cost of products purchased from third-party vendors, generally<br />
in U.S. dollars;<br />
• costs of self-manufactured products;<br />
• cost of sales materials which we sell to distributors at or near<br />
cost;<br />
• amortization expenses associated with certain products and<br />
services such as the Pharmanex BioPhotonic Scanners that are<br />
leased to distributors;<br />
• freight cost of shipping products to distributors and import<br />
duties for the products; and<br />
• royalties and related expenses for licensed technologies.<br />
We source the majority of our products from third-party manufacturers<br />
located in the United States. Due to Chinese government<br />
36