Nu Skin 2010 Annual Report - Direct Selling News
Nu Skin 2010 Annual Report - Direct Selling News
Nu Skin 2010 Annual Report - Direct Selling News

You also want an ePaper? Increase the reach of your titles
YUMPU automatically turns print PDFs into web optimized ePapers that Google loves.
employees in Mainland China who had been purchasing products in<br />
2008 from Hong Kong that were not available in Mainland China such<br />
as our Galvanic Spa System II. Executive distributors in Hong Kong<br />
were up 15% and the active distributors in Hong Kong were down 4%<br />
compared to 2008.<br />
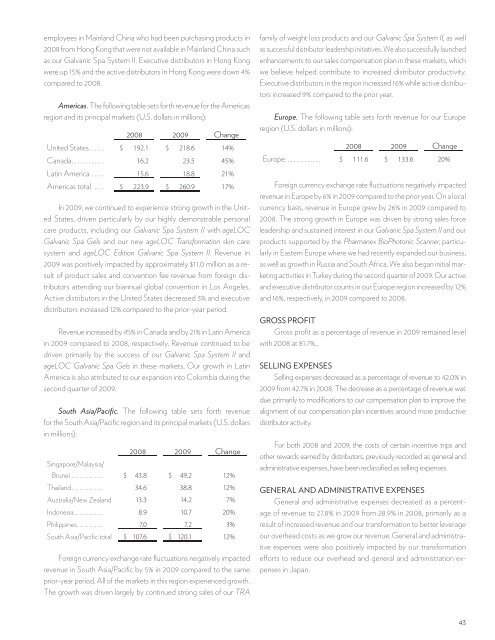
Americas. The following table sets forth revenue for the Americas<br />
region and its principal markets (U.S. dollars in millions):<br />
2008 2009 Change<br />
United States . . . . . . $ 192.1 $ 218.6 14%<br />
Canada . . . . . . . . . . . . 16.2 23.5 45%<br />
Latin America . . . . . 15.6 18.8 21%<br />
Americas total . . . . $ 223.9 $ 260.9 17%<br />
In 2009, we continued to experience strong growth in the United<br />
States, driven particularly by our highly demonstrable personal<br />
care products, including our Galvanic Spa System II with ageLOC<br />
Galvanic Spa Gels and our new ageLOC Transformation skin care<br />
system and ageLOC Edition Galvanic Spa System II. Revenue in<br />
2009 was positively impacted by approximately $11.0 million as a result<br />
of product sales and convention fee revenue from foreign distributors<br />
attending our biannual global convention in Los Angeles.<br />
Active distributors in the United States decreased 3% and executive<br />
distributors increased 12% compared to the prior-year period.<br />
Revenue increased by 45% in Canada and by 21% in Latin America<br />
in 2009 compared to 2008, respectively. Revenue continued to be<br />
driven primarily by the success of our Galvanic Spa System II and<br />
ageLOC Galvanic Spa Gels in these markets. Our growth in Latin<br />
America is also attributed to our expansion into Colombia during the<br />
second quarter of 2009.<br />
South Asia/Pacific. The following table sets forth revenue<br />
for the South Asia/Pacific region and its principal markets (U.S. dollars<br />
in millions):<br />
2008 2009 Change<br />
Singapore/Malaysia/<br />
Brunei . . . . . . . . . . . . . $ 43.8 $ 49.2 12%<br />
Thailand . . . . . . . . . . . . . 34.6 38.8 12%<br />
Australia/New Zealand 13.3 14.2 7%<br />
Indonesia . . . . . . . . . . . . 8.9 10.7 20%<br />
Philippines . . . . . . . . . . . 7.0 7.2 3%<br />
South Asia/Pacific total $ 107.6 $ 120.1 12%<br />
Foreign currency exchange rate fluctuations negatively impacted<br />
revenue in South Asia/Pacific by 5% in 2009 compared to the same<br />
prior-year period. All of the markets in this region experienced growth.<br />
The growth was driven largely by continued strong sales of our TRA<br />
family of weight loss products and our Galvanic Spa System II, as well<br />
as successful distributor leadership initiatives. We also successfully launched<br />
enhancements to our sales compensation plan in these markets, which<br />
we believe helped contribute to increased distributor productivity.<br />
Executive distributors in the region increased 16% while active distributors<br />
increased 9% compared to the prior year.<br />
Europe. The following table sets forth revenue for our Europe<br />
region (U.S. dollars in millions):<br />
2008 2009 Change<br />
Europe . . . . . . . . . . . . . $ 111.6 $ 133.6 20%<br />
Foreign currency exchange rate fluctuations negatively impacted<br />
revenue in Europe by 6% in 2009 compared to the prior year. On a local<br />
currency basis, revenue in Europe grew by 26% in 2009 compared to<br />
2008. The strong growth in Europe was driven by strong sales force<br />
leadership and sustained interest in our Galvanic Spa System II and our<br />
products supported by the Pharmanex BioPhotonic Scanner, particularly<br />
in Eastern Europe where we had recently expanded our business,<br />
as well as growth in Russia and South Africa. We also began initial marketing<br />
activities in Turkey during the second quarter of 2009. Our active<br />
and executive distributor counts in our Europe region increased by 12%<br />
and 16%, respectively, in 2009 compared to 2008.<br />
GROSS PROFIT<br />
Gross profit as a percentage of revenue in 2009 remained level<br />
with 2008 at 81.7%..<br />
SELLING EXPENSES<br />
<strong>Selling</strong> expenses decreased as a percentage of revenue to 42.0% in<br />
2009 from 42.7% in 2008. The decrease as a percentage of revenue was<br />
due primarily to modifications to our compensation plan to improve the<br />
alignment of our compensation plan incentives around more productive<br />
distributor activity.<br />
For both 2008 and 2009, the costs of certain incentive trips and<br />
other rewards earned by distributors, previously recorded as general and<br />
administrative expenses, have been reclassified as selling expenses.<br />
GENERAL AND ADMINISTRATIVE EXPENSES<br />
General and administrative expenses decreased as a percentage<br />
of revenue to 27.8% in 2009 from 28.9% in 2008, primarily as a<br />
result of increased revenue and our transformation to better leverage<br />
our overhead costs as we grow our revenue. General and administrative<br />
expenses were also positively impacted by our transformation<br />
efforts to reduce our overhead and general and administration expenses<br />
in Japan.<br />
43