Nu Skin 2010 Annual Report - Direct Selling News
Nu Skin 2010 Annual Report - Direct Selling News
Nu Skin 2010 Annual Report - Direct Selling News

Create successful ePaper yourself
Turn your PDF publications into a flip-book with our unique Google optimized e-Paper software.
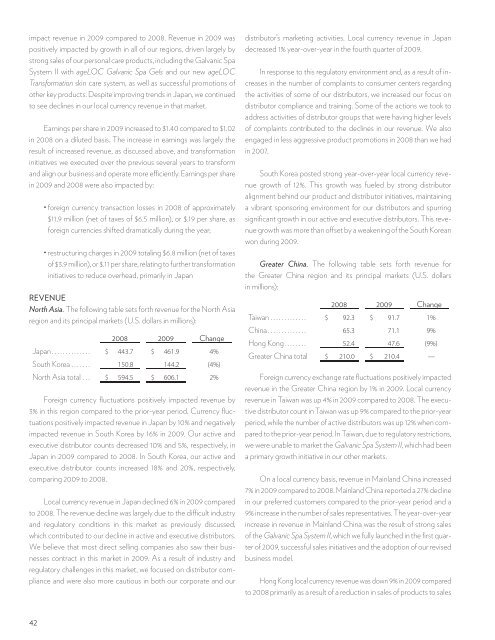
impact revenue in 2009 compared to 2008. Revenue in 2009 was<br />
positively impacted by growth in all of our regions, driven largely by<br />
strong sales of our personal care products, including the Galvanic Spa<br />
System II with ageLOC Galvanic Spa Gels and our new ageLOC<br />
Transformation skin care system, as well as successful promotions of<br />
other key products. Despite improving trends in Japan, we continued<br />
to see declines in our local currency revenue in that market.<br />
Earnings per share in 2009 increased to $1.40 compared to $1.02<br />
in 2008 on a diluted basis. The increase in earnings was largely the<br />
result of increased revenue, as discussed above, and transformation<br />
initiatives we executed over the previous several years to transform<br />
and align our business and operate more efficiently. Earnings per share<br />
in 2009 and 2008 were also impacted by:<br />
• foreign currency transaction losses in 2008 of approximately<br />
$11.9 million (net of taxes of $6.5 million), or $.19 per share, as<br />
foreign currencies shifted dramatically during the year;<br />
• restructuring charges in 2009 totaling $6.8 million (net of taxes<br />
of $3.9 million), or $.11 per share, relating to further transformation<br />
initiatives to reduce overhead, primarily in Japan<br />
REVENUE<br />
North Asia. The following table sets forth revenue for the North Asia<br />
region and its principal markets (U.S. dollars in millions):<br />
2008 2009 Change<br />
Japan . . . . . . . . . . . . . . $ 443.7 $ 461.9 4%<br />
South Korea . . . . . . . 150.8 144.2 (4%)<br />
North Asia total . . . $ 594.5 $ 606.1 2%<br />
Foreign currency fluctuations positively impacted revenue by<br />
3% in this region compared to the prior-year period. Currency fluctuations<br />
positively impacted revenue in Japan by 10% and negatively<br />
impacted revenue in South Korea by 16% in 2009. Our active and<br />
executive distributor counts decreased 10% and 5%, respectively, in<br />
Japan in 2009 compared to 2008. In South Korea, our active and<br />
executive distributor counts increased 18% and 20%, respectively,<br />
comparing 2009 to 2008.<br />
Local currency revenue in Japan declined 6% in 2009 compared<br />
to 2008. The revenue decline was largely due to the difficult industry<br />
and regulatory conditions in this market as previously discussed,<br />
which contributed to our decline in active and executive distributors.<br />
We believe that most direct selling companies also saw their businesses<br />
contract in this market in 2009. As a result of industry and<br />
regulatory challenges in this market, we focused on distributor compliance<br />
and were also more cautious in both our corporate and our<br />
distributor’s marketing activities. Local currency revenue in Japan<br />
decreased 1% year-over-year in the fourth quarter of 2009.<br />
In response to this regulatory environment and, as a result of increases<br />
in the number of complaints to consumer centers regarding<br />
the activities of some of our distributors, we increased our focus on<br />
distributor compliance and training. Some of the actions we took to<br />
address activities of distributor groups that were having higher levels<br />
of complaints contributed to the declines in our revenue. We also<br />
engaged in less aggressive product promotions in 2008 than we had<br />
in 2007.<br />
South Korea posted strong year-over-year local currency revenue<br />
growth of 12%. This growth was fueled by strong distributor<br />
alignment behind our product and distributor initiatives, maintaining<br />
a vibrant sponsoring environment for our distributors and spurring<br />
significant growth in our active and executive distributors. This revenue<br />
growth was more than offset by a weakening of the South Korean<br />
won during 2009.<br />
Greater China. The following table sets forth revenue for<br />
the Greater China region and its principal markets (U.S. dollars<br />
in millions):<br />
2008 2009 Change<br />
Taiwan . . . . . . . . . . . . . $ 92.3 $ 91.7 1%<br />
China . . . . . . . . . . . . . . 65.3 71.1 9%<br />
Hong Kong . . . . . . . . 52.4 47.6 (9%)<br />
Greater China total $ 210.0 $ 210.4 —<br />
Foreign currency exchange rate fluctuations positively impacted<br />
revenue in the Greater China region by 1% in 2009. Local currency<br />
revenue in Taiwan was up 4% in 2009 compared to 2008. The executive<br />
distributor count in Taiwan was up 9% compared to the prior-year<br />
period, while the number of active distributors was up 12% when compared<br />
to the prior-year period. In Taiwan, due to regulatory restrictions,<br />
we were unable to market the Galvanic Spa System II, which had been<br />
a primary growth initiative in our other markets.<br />
On a local currency basis, revenue in Mainland China increased<br />
7% in 2009 compared to 2008. Mainland China reported a 27% decline<br />
in our preferred customers compared to the prior-year period and a<br />
9% increase in the number of sales representatives. The year-over-year<br />
increase in revenue in Mainland China was the result of strong sales<br />
of the Galvanic Spa System II, which we fully launched in the first quarter<br />
of 2009, successful sales initiatives and the adoption of our revised<br />
business model.<br />
Hong Kong local currency revenue was down 9% in 2009 compared<br />
to 2008 primarily as a result of a reduction in sales of products to sales<br />
42