Radar Technology for Level Gauging - Krohne
Radar Technology for Level Gauging - Krohne
Radar Technology for Level Gauging - Krohne

You also want an ePaper? Increase the reach of your titles
YUMPU automatically turns print PDFs into web optimized ePapers that Google loves.
3. <strong>Radar</strong>-Füllstandsmesssysteme<br />
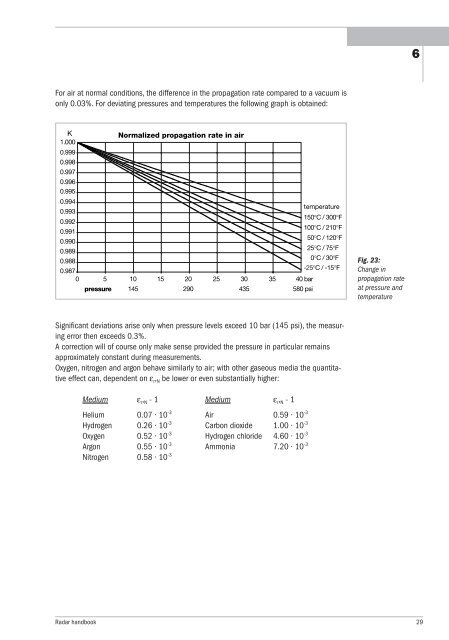
For air at normal conditions, the difference in the propagation rate compared to a vacuum is<br />
only 0.03%. For deviating pressures and temperatures the following graph is obtained:<br />
K Normalized propagation rate in air<br />
1.000<br />
0.999<br />
0.998<br />
0.997<br />
0.996<br />
0.995<br />
0.994<br />
0.993<br />
0.992<br />
0.991<br />
0.990<br />
temperature<br />
150°C / 300°F<br />
100°C / 210°F<br />
150°C / 120°F<br />
0.989<br />
125°C / 75°F<br />
0.988<br />
110°C / 30°F<br />
0.987<br />
-25°C / -15°F<br />
0 5 10 15 20 25 30 35 40 bar<br />
pressure<br />
145 290 435 580 psi<br />
Significant deviations arise only when pressure levels exceed 10 bar (145 psi), the measuring<br />
error then exceeds 0.3%.<br />
A correction will of course only make sense provided the pressure in particular remains<br />
approximately constant during measurements.<br />
Oxygen, nitrogen and argon behave similarly to air; with other gaseous media the quantitative<br />
effect can, dependent on ε r, N be lower or even substantially higher:<br />
Medium εr, N - 1 Medium εr, N - 1<br />
Helium 0.07 · 10 -3 Air 0.59 · 10-3 Hydrogen 0.26 · 10-3 Carbon dioxide 1.00 · 10-3 Oxygen 0.52 · 10-3 Hydrogen chloride 4.60 · 10-3 Argon 0.55 · 10-3 Ammonia 7.20 · 10-3 Nitrogen 0.58 · 10-3 Fig. 23:<br />
Change in<br />
propagation rate<br />
at pressure and<br />
temperature<br />
<strong>Radar</strong> handbook 29<br />
6