

Heat
heat-story
heat-story

Create successful ePaper yourself
Turn your PDF publications into a flip-book with our unique Google optimized e-Paper software.
Observed Climate Changes and Impacts<br />
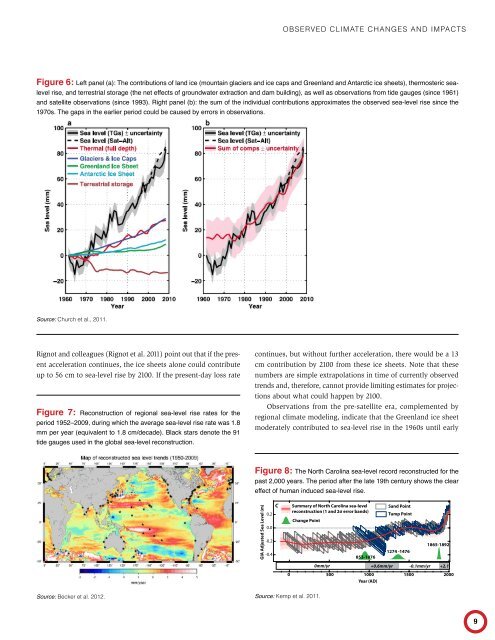
Figure 6: Left panel (a): The contributions of land ice (mountain glaciers and ice caps and Greenland and Antarctic ice sheets), thermosteric sealevel<br />
rise, and terrestrial storage (the net effects of groundwater extraction and dam building), as well as observations from tide gauges (since 1961)<br />
and satellite observations (since 1993). Right panel (b): the sum of the individual contributions approximates the observed sea-level rise since the<br />
1970s. The gaps in the earlier period could be caused by errors in observations.<br />
Source: Church et al., 2011.<br />
Rignot and colleagues (Rignot et al. 2011) point out that if the present<br />
acceleration continues, the ice sheets alone could contribute<br />
up to 56 cm to sea-level rise by 2100. If the present-day loss rate<br />
Figure 7: Reconstruction of regional sea-level rise rates for the<br />
period 1952–2009, during which the average sea-level rise rate was 1.8<br />
mm per year (equivalent to 1.8 cm/decade). Black stars denote the 91<br />
tide gauges used in the global sea-level reconstruction.<br />
Source: Becker et al. 2012.<br />
continues, but without further acceleration, there would be a 13<br />
cm contribution by 2100 from these ice sheets. Note that these<br />
numbers are simple extrapolations in time of currently observed<br />
1.0 A<br />
trends 0.8 and, therefore, cannot provide limiting estimates for projections<br />
0.6about HADCrutv3<br />
what could happen by 2100.<br />
0.4<br />
Instrumental Record<br />
Observations from the pre-satellite era, complemented by<br />
0.2<br />
regional 0.0 climate modeling, indicate that the Greenland ice sheet<br />
-0.2<br />
moderately EIV Global contributed (Land + Ocean) to Reconstruction sea-level rise in the 1960s until early<br />
Temperature (oC)<br />
Relative Sea Level (m MSL)<br />
(Mann et al., 2008)<br />
Figure 8: The North Carolina sea-level record reconstructed for the<br />
past 2,000 years. The period after the Tide-gauge late 19th records century Reconstructions shows the clear<br />
-2.0<br />
Sand Point<br />
effect of human induced sea-level rise.<br />
GIA Adjusted Sea Level (m)<br />
-0.4<br />
0.0<br />
-0.5<br />
-1.0<br />
-2.5<br />
0.2<br />
0.0<br />
-0.2<br />
-0.4<br />
B<br />
-1.5 1860<br />
C<br />
1900 1940 1980<br />
Year (AD)<br />
Summary of North Carolina sea-level<br />
reconstruction (1 and 2σ error bands)<br />
Change Point<br />
0.0<br />
-0.2<br />
-0.4<br />
RSL (m MSL)<br />
853-1076<br />
North Carolina<br />
Charleston, SC<br />
Sand Point<br />
Tump Point<br />
1274 -1476<br />
(inset)<br />
Tump Point<br />
1865-1892<br />
0mm/yr +0.6mm/yr -0.1mm/yr +2.1<br />
0 500 1000 1500 2000<br />
Year (AD)<br />
Source: Kemp et al. 2011.<br />
9