

Heat
heat-story
heat-story

Create successful ePaper yourself
Turn your PDF publications into a flip-book with our unique Google optimized e-Paper software.
Turn Down the <strong>Heat</strong>: Why a 4°C Warmer World Must Be Avoided<br />
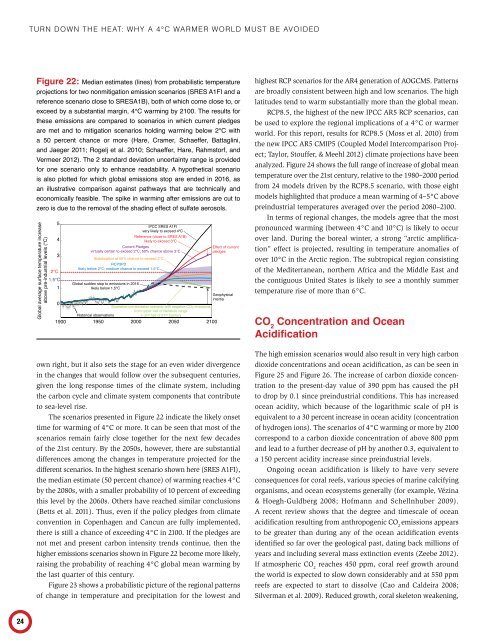
Figure 22: Median estimates (lines) from probabilistic temperature<br />
projections for two nonmitigation emission scenarios (SRES A1FI and a<br />
reference scenario close to SRESA1B), both of which come close to, or<br />
exceed by a substantial margin, 4°C warming by 2100. The results for<br />
these emissions are compared to scenarios in which current pledges<br />
are met and to mitigation scenarios holding warming below 2°C with<br />
a 50 percent chance or more (Hare, Cramer, Schaeffer, Battaglini,<br />
and Jaeger 2011; Rogelj et al. 2010; Schaeffer, Hare, Rahmstorf, and<br />
Vermeer 2012). The 2 standard deviation uncertainty range is provided<br />
for one scenario only to enhance readability. A hypothetical scenario<br />
is also plotted for which global emissions stop are ended in 2016, as<br />
an illustrative comparison against pathways that are technically and<br />
economically feasible. The spike in warming after emissions are cut to<br />
zero is due to the removal of the shading effect of sulfate aerosols.<br />
Global average surface temperature increase<br />
above pre-industrial levels (°C)<br />
5<br />
4<br />
IPCC SRES A1FI<br />
very likely to exceed 4°C<br />
Reference (close to SRES A1B)<br />
likely to exceed 3°C<br />
Current Pledges<br />
Effect of current<br />
virtually certain to exceed 2°C; 50% chance above 3°C<br />
pledges<br />
3<br />
Stabilization at 50% chance to exceed 2°C<br />
RCP3PD<br />
likely below 2°C; medium chance to exceed 1.5°C<br />
2°C<br />
1.5°C<br />
Global sudden stop to emissions in 2016<br />
1<br />
likely below 1.5°C<br />
Geophysical<br />
intertia<br />
0<br />
Illustrative low-emission scenario with negative CO2 emissions<br />
from upper half of literature range<br />
Historical observations in 2nd half of 21st Century<br />
1900 1950 2000 2050<br />
2100<br />
own right, but it also sets the stage for an even wider divergence<br />
in the changes that would follow over the subsequent centuries,<br />
given the long response times of the climate system, including<br />
the carbon cycle and climate system components that contribute<br />
to sea-level rise.<br />
The scenarios presented in Figure 22 indicate the likely onset<br />
time for warming of 4°C or more. It can be seen that most of the<br />
scenarios remain fairly close together for the next few decades<br />
of the 21st century. By the 2050s, however, there are substantial<br />
differences among the changes in temperature projected for the<br />
different scenarios. In the highest scenario shown here (SRES A1FI),<br />
the median estimate (50 percent chance) of warming reaches 4°C<br />
by the 2080s, with a smaller probability of 10 percent of exceeding<br />
this level by the 2060s. Others have reached similar conclusions<br />
(Betts et al. 2011). Thus, even if the policy pledges from climate<br />
convention in Copenhagen and Cancun are fully implemented,<br />
there is still a chance of exceeding 4°C in 2100. If the pledges are<br />
not met and present carbon intensity trends continue, then the<br />
higher emissions scenarios shown in Figure 22 become more likely,<br />
raising the probability of reaching 4°C global mean warming by<br />
the last quarter of this century.<br />
Figure 23 shows a probabilistic picture of the regional patterns<br />
of change in temperature and precipitation for the lowest and<br />
highest RCP scenarios for the AR4 generation of AOGCMS. Patterns<br />
are broadly consistent between high and low scenarios. The high<br />
latitudes tend to warm substantially more than the global mean.<br />
RCP8.5, the highest of the new IPCC AR5 RCP scenarios, can<br />
be used to explore the regional implications of a 4°C or warmer<br />
world. For this report, results for RCP8.5 (Moss et al. 2010) from<br />
the new IPCC AR5 CMIP5 (Coupled Model Intercomparison Project;<br />
Taylor, Stouffer, & Meehl 2012) climate projections have been<br />
analyzed. Figure 24 shows the full range of increase of global mean<br />
temperature over the 21st century, relative to the 1980–2000 period<br />
from 24 models driven by the RCP8.5 scenario, with those eight<br />
models highlighted that produce a mean warming of 4–5°C above<br />
preindustrial temperatures averaged over the period 2080–2100.<br />
In terms of regional changes, the models agree that the most<br />
pronounced warming (between 4°C and 10°C) is likely to occur<br />
over land. During the boreal winter, a strong “arctic amplification”<br />
effect is projected, resulting in temperature anomalies of<br />
over 10°C in the Arctic region. The subtropical region consisting<br />
of the Mediterranean, northern Africa and the Middle East and<br />
the contiguous United States is likely to see a monthly summer<br />
temperature rise of more than 6°C.<br />
CO 2<br />
Concentration and Ocean<br />
Acidification<br />
The high emission scenarios would also result in very high carbon<br />
dioxide concentrations and ocean acidification, as can be seen in<br />
Figure 25 and Figure 26. The increase of carbon dioxide concentration<br />
to the present-day value of 390 ppm has caused the pH<br />
to drop by 0.1 since preindustrial conditions. This has increased<br />
ocean acidity, which because of the logarithmic scale of pH is<br />
equivalent to a 30 percent increase in ocean acidity (concentration<br />
of hydrogen ions). The scenarios of 4°C warming or more by 2100<br />
correspond to a carbon dioxide concentration of above 800 ppm<br />
and lead to a further decrease of pH by another 0.3, equivalent to<br />
a 150 percent acidity increase since preindustrial levels.<br />
Ongoing ocean acidification is likely to have very severe<br />
consequences for coral reefs, various species of marine calcifying<br />
organisms, and ocean ecosystems generally (for example, Vézina<br />
& Hoegh-Guldberg 2008; Hofmann and Schellnhuber 2009).<br />
A recent review shows that the degree and timescale of ocean<br />
acidification resulting from anthropogenic CO 2<br />
emissions appears<br />
to be greater than during any of the ocean acidification events<br />
identified so far over the geological past, dating back millions of<br />
years and including several mass extinction events (Zeebe 2012).<br />
If atmospheric CO 2<br />
reaches 450 ppm, coral reef growth around<br />
the world is expected to slow down considerably and at 550 ppm<br />
reefs are expected to start to dissolve (Cao and Caldeira 2008;<br />
Silverman et al. 2009). Reduced growth, coral skeleton weakening,<br />
24