

Heat
heat-story
heat-story

Create successful ePaper yourself
Turn your PDF publications into a flip-book with our unique Google optimized e-Paper software.
Turn Down the <strong>Heat</strong>: Why a 4°C Warmer World Must Be Avoided<br />
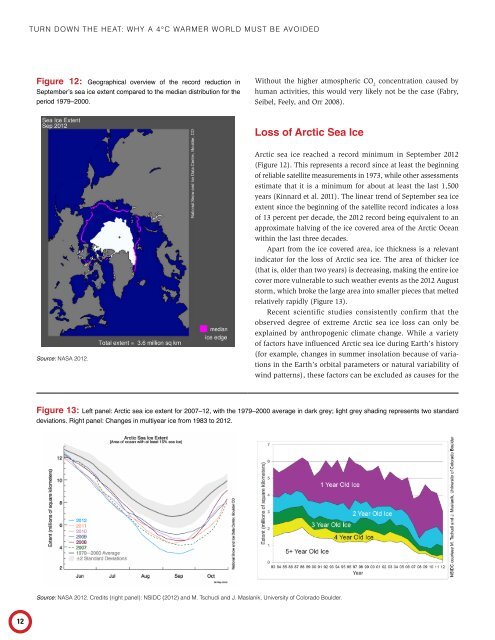
Figure 12: Geographical overview of the record reduction in<br />
September’s sea ice extent compared to the median distribution for the<br />
period 1979–2000.<br />
Without the higher atmospheric CO 2<br />
concentration caused by<br />
human activities, this would very likely not be the case (Fabry,<br />
Seibel, Feely, and Orr 2008).<br />
Loss of Arctic Sea Ice<br />
Source: NASA 2012.<br />
Arctic sea ice reached a record minimum in September 2012<br />
(Figure 12). This represents a record since at least the beginning<br />
of reliable satellite measurements in 1973, while other assessments<br />
estimate that it is a minimum for about at least the last 1,500<br />
years (Kinnard et al. 2011). The linear trend of September sea ice<br />
extent since the beginning of the satellite record indicates a loss<br />
of 13 percent per decade, the 2012 record being equivalent to an<br />
approximate halving of the ice covered area of the Arctic Ocean<br />
within the last three decades.<br />
Apart from the ice covered area, ice thickness is a relevant<br />
indicator for the loss of Arctic sea ice. The area of thicker ice<br />
(that is, older than two years) is decreasing, making the entire ice<br />
cover more vulnerable to such weather events as the 2012 August<br />
storm, which broke the large area into smaller pieces that melted<br />
relatively rapidly (Figure 13).<br />
Recent scientific studies consistently confirm that the<br />
observed degree of extreme Arctic sea ice loss can only be<br />
explained by anthropogenic climate change. While a variety<br />
of factors have influenced Arctic sea ice during Earth’s history<br />
(for example, changes in summer insolation because of variations<br />
in the Earth’s orbital parameters or natural variability of<br />
wind patterns), these factors can be excluded as causes for the<br />
Figure 13: Left panel: Arctic sea ice extent for 2007–12, with the 1979–2000 average in dark grey; light grey shading represents two standard<br />
deviations. Right panel: Changes in multiyear ice from 1983 to 2012.<br />
Source: NASA 2012. Credits (right panel): NSIDC (2012) and M. Tschudi and J. Maslanik, University of Colorado Boulder.<br />
12