

Heat
heat-story
heat-story

You also want an ePaper? Increase the reach of your titles
YUMPU automatically turns print PDFs into web optimized ePapers that Google loves.
Turn Down the <strong>Heat</strong>: Why a 4°C Warmer World Must Be Avoided<br />
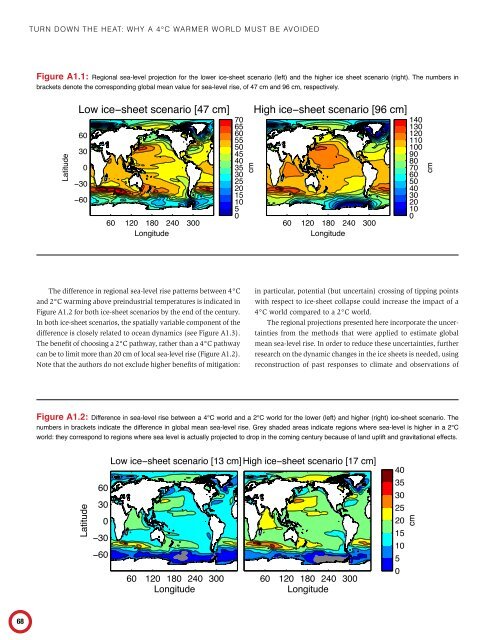
Figure A1.1: Regional sea-level projection for the lower ice-sheet scenario (left) and the higher ice sheet scenario (right). The numbers in<br />
brackets denote the corresponding global mean value for sea-level rise, of 47 cm and 96 cm, respectively.<br />
Latitude<br />
Low ice−sheet scenario [47 cm]<br />
60<br />
30<br />
0<br />
−30<br />
−60<br />
60 120 180 240 300<br />
Longitude<br />
70<br />
65<br />
60<br />
55<br />
50<br />
45<br />
40<br />
35<br />
30<br />
25<br />
20<br />
15<br />
10<br />
5<br />
0<br />
cm<br />
High ice−sheet scenario [96 cm]<br />
60 120 180 240 300<br />
Longitude<br />
140<br />
130<br />
120<br />
110<br />
100<br />
90<br />
80<br />
70<br />
60<br />
50<br />
40<br />
30<br />
20<br />
10<br />
0<br />
cm<br />
The difference in regional sea-level rise patterns between 4°C<br />
and 2°C warming above preindustrial temperatures is indicated in<br />
Figure A1.2 for both ice-sheet scenarios by the end of the century.<br />
In both ice-sheet scenarios, the spatially variable component of the<br />
difference is closely related to ocean dynamics (see Figure A1.3).<br />
The benefit of choosing a 2°C pathway, rather than a 4°C pathway<br />
can be to limit more than 20 cm of local sea-level rise (Figure A1.2).<br />
Note that the authors do not exclude higher benefits of mitigation:<br />
in particular, potential (but uncertain) crossing of tipping points<br />
with respect to ice-sheet collapse could increase the impact of a<br />
4°C world compared to a 2°C world.<br />
The regional projections presented here incorporate the uncertainties<br />
from the methods that were applied to estimate global<br />
mean sea-level rise. In order to reduce these uncertainties, further<br />
research on the dynamic changes in the ice sheets is needed, using<br />
reconstruction of past responses to climate and observations of<br />
Figure A1.2: Difference in sea-level rise between a 4°C world and a 2°C world for the lower (left) and higher (right) ice-sheet scenario. The<br />
numbers in brackets indicate the difference in global mean sea-level rise. Grey shaded areas indicate regions where sea-level is higher in a 2°C<br />
world: they correspond to regions where sea level is actually projected to drop in the coming century because of land uplift and gravitational effects.<br />
Latitude<br />
Low ice−sheet scenario [13 cm] High ice−sheet scenario [17 cm]<br />
60<br />
30<br />
0<br />
−30<br />
−60<br />
60 120 180 240 300 60 120 180 240 300<br />
Longitude<br />
Longitude<br />
40<br />
35<br />
30<br />
25<br />
20<br />
15<br />
10<br />
5<br />
0<br />
cm<br />
68