

Heat
heat-story
heat-story

Create successful ePaper yourself
Turn your PDF publications into a flip-book with our unique Google optimized e-Paper software.
21st Century Projections<br />
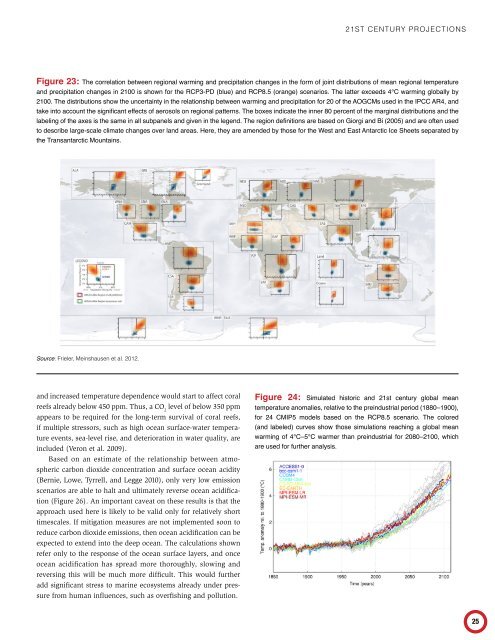
Figure 23: The correlation between regional warming and precipitation changes in the form of joint distributions of mean regional temperature<br />
and precipitation changes in 2100 is shown for the RCP3-PD (blue) and RCP8.5 (orange) scenarios. The latter exceeds 4°C warming globally by<br />
2100. The distributions show the uncertainty in the relationship between warming and precipitation for 20 of the AOGCMs used in the IPCC AR4, and<br />
take into account the significant effects of aerosols on regional patterns. The boxes indicate the inner 80 percent of the marginal distributions and the<br />
labeling of the axes is the same in all subpanels and given in the legend. The region definitions are based on Giorgi and Bi (2005) and are often used<br />
to describe large-scale climate changes over land areas. Here, they are amended by those for the West and East Antarctic Ice Sheets separated by<br />
the Transantarctic Mountains.<br />
Source: Frieler, Meinshausen et al. 2012.<br />
and increased temperature dependence would start to affect coral<br />
reefs already below 450 ppm. Thus, a CO 2<br />
level of below 350 ppm<br />
appears to be required for the long-term survival of coral reefs,<br />
if multiple stressors, such as high ocean surface-water temperature<br />
events, sea-level rise, and deterioration in water quality, are<br />
included (Veron et al. 2009).<br />
Based on an estimate of the relationship between atmospheric<br />
carbon dioxide concentration and surface ocean acidity<br />
(Bernie, Lowe, Tyrrell, and Legge 2010), only very low emission<br />
scenarios are able to halt and ultimately reverse ocean acidification<br />
(Figure 26). An important caveat on these results is that the<br />
approach used here is likely to be valid only for relatively short<br />
timescales. If mitigation measures are not implemented soon to<br />
reduce carbon dioxide emissions, then ocean acidification can be<br />
expected to extend into the deep ocean. The calculations shown<br />
refer only to the response of the ocean surface layers, and once<br />
ocean acidification has spread more thoroughly, slowing and<br />
reversing this will be much more difficult. This would further<br />
add significant stress to marine ecosystems already under pressure<br />
from human influences, such as overfishing and pollution.<br />
Figure 24: Simulated historic and 21st century global mean<br />
temperature anomalies, relative to the preindustrial period (1880–1900),<br />
for 24 CMIP5 models based on the RCP8.5 scenario. The colored<br />
(and labeled) curves show those simulations reaching a global mean<br />
warming of 4°C–5°C warmer than preindustrial for 2080–2100, which<br />
are used for further analysis.<br />
25