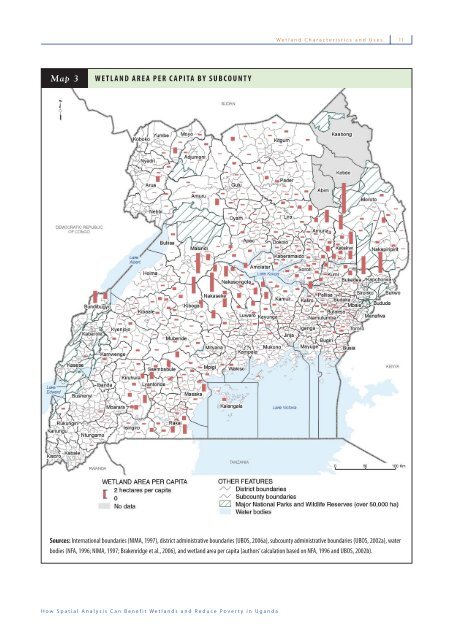
10 Wetland Characteristics and Uses Figure 1 DISTRIBUTION OF MAIN LAND COVER TYPES IN UGANDA’S PERMANENT AND SEASONAL WETLANDS, 1996 Source: Authors’ calculation based on NFA, 1996. Note: Percentage share of Uganda’s total wetland area. While Map 2 provides a view of the national wetlands distribution and shows their location in every district, local governments and community-based resource user groups need more specifi c information. First and foremost, local decision-makers need to know what wetland resources they have and the pressure these resources are under. A simple indicator for a local decision-maker, for example, would measure wetland area per capita, which is the total wetland area of an administrative unit divided by its total population. Such an indicator assumes the following: the more numerous the population in an administrative area, the higher the potential demand on wetland resources, which can lead to a greater number of people fi shing, withdrawing water, collecting vegetation, growing crops, extracting clay, constructing houses, or releasing pollutants. Wetland area per capita can therefore be interpreted as a fi rst proxy to measure potential resource usage, and thus pressure on wetlands. Map 3 displays wetland area per capita by subcounty, represented by the height of the red bar. Wetland area per person varies broadly among the 938 subcounties with data. (The data for the 20 subcounties of Kotido, Kaabong, and Abim Districts are not shown because the census data were deemed unreliable.) Most subcounties in Uganda have less than 0.2 hectares of wetland area per person (very short red bars). This implies either that wetlands in these areas are sparse (such as in subcounties of Mbale, Arua, and Mbarara Districts) or that they have to be shared among a large number of people (such as in the subcounties of Pallisa, Iganga, and Tororo Districts). Subcounties with high wetland area per capita (long red bars) are in Kapchorwa, Katakwi, and Moroto Districts (northeastern Uganda). They are also very common in subcounties lying within the triangle formed by Masindi, Kiboga, and Nakasongola Districts, southwest of Lake Kyoga. In general, most subcounties with high wetland area per capita are distinguished by the presence of a specifi c type of wetland—seasonally wet grasslands—and lower population densities (NFA, 1996; UBOS, 2002b). Map 3 clearly indicates that the potential demand pressure on wetlands varies across the country but few areas have low pressure (long red bars). Most subcounties have potentially high demand pressure on their wetlands. A decision-maker in a subcounty with high wetland area per capita can formulate the following hypotheses based on this map: Pressure on these wetlands from resource demand is likely to be lower than the rest of the country. These wetlands should be able to make a larger per capita contribution both with marketable wetland products and non-marketable wetland ecosystem services. On the other hand, a decision-maker responsible for a subcounty with low wetland area per capita—resulting from a very large number of people sharing a relatively small wetland area—can gain the following insights from this map: Competition between different wetland uses has to be carefully managed. Special attention has to be paid so as not to undermine the capacity of the wetland to provide its products and services. There is a more urgent need to establish well-functioning management plans and zoning of land uses because of the potential for high demand pressure. These wetlands will need to be more closely monitored for their resource use. Economic returns from resource extraction of marketable products potentially have to be shared among a larger number of people, resulting in low average per capita values. While the wetland area per person may be low, these wetlands may still be of great importance locally, for example as a dry season grazing refuge, or nationally, for example to provide habitat for rare species. In subcounties with large wetlands but very low per capita wetland area—for example wetlands close to an urban center—it is especially important to evaluate a comprehensive set of ecosystem services provided by these wetlands. For such wetlands, it may make little sense to promote increased harvesting of low-return wetland products, especially if this carries the risk of undermining other ecosystem services. Such increases may not provide MAPPING A BETTER FUTURE
Wetland Characteristics and Uses 11 Map 3 WETLAND AREA PER CAPITA BY SUBCOUNTY Sources: International boundaries (NIMA, 1997), district administrative boundaries (UBOS, 2006a), subcounty administrative boundaries (UBOS, 2002a), water bodies (NFA, 1996; NIMA, 1997; Brakenridge et al., 2006), and wetland area per capita (authors’ calculation based on NFA, 1996 and UBOS, 2002b). How Spatial Analysis Can Benefit Wetlands and Reduce Poverty in Uganda