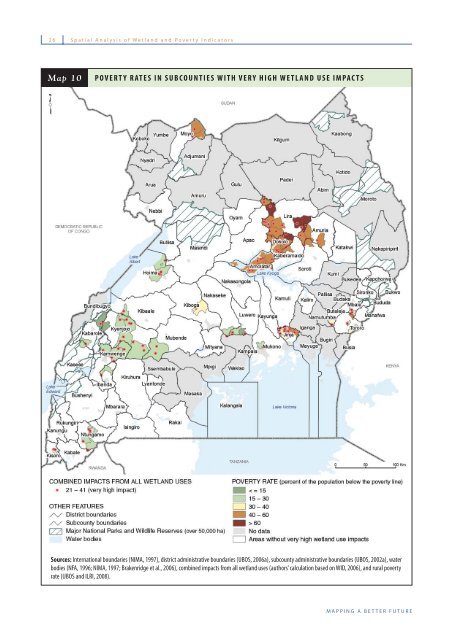
26 Spatial Analysis of Wetland and Poverty Indicators Map 10 POVERTY RATES IN SUBCOUNTIES WITH VERY HIGH WETLAND USE IMPACTS Sources: International boundaries (NIMA, 1997), district administrative boundaries (UBOS, 2006a), subcounty administrative boundaries (UBOS, 2002a), water bodies (NFA, 1996; NIMA, 1997; Brakenridge et al., 2006), combined impacts from all wetland uses (authors’ calculation based on WID, 2006), and rural poverty rate (UBOS and ILRI, 2008). MAPPING A BETTER FUTURE
Adding Value 27 Adding Value: Combining Wetland and Poverty Maps with Economic Analysis The map overlays highlighted in the previous chapter represent only the fi rst step in analyzing the benefi ts wetlands provide to people in general and to poor communities more specifi cally. Additional analyses are needed to manage wetlands in a more sustainable manner, identify and plan development interventions better, and target poverty reduction efforts more precisely. Combining three types of data can greatly enhance these analyses: location of specifi c wetland uses, extent of use, and economic value of use. To manage wetlands sustainably, it is important to know not only the type and location of each use, but also to track the exact quantity of each product or service obtained from a wetland. This could include the quantity of papyrus harvested, fi sh caught, water withdrawn, wood collected, fodder obtained, or wastewater fi ltered. These data can then be compared to the capacity of a wetland to provide these products and services (e.g., regeneration rate of plants, or the total fi ltering and waste assimilation capacity) to determine a sustainable use pattern. To identify and plan development interventions better, an analysis of wetland uses needs to identify the benefi ciaries (socioeconomic profi le of wetland users) and incorporate livelihood perspectives, economic costs, and economic benefi ts of different wetland uses. Knowing the economic value of these uses enables analysts to calculate the economic returns per area or labor input and to assess their contribution to household incomes. For a wetland product with an existing market, an economist will multiply the quantity of a harvested product by its market price. For a wetland service without an existing market such as water fi ltration, economists rely on special valuation tools such as the Replacement Cost Method that estimates the amount of money that could be saved by not building a wastewater treatment facility (Ranganathan et al., 2008). To target poverty reduction efforts more precisely, decision-makers need to know whether specifi c wetland uses provide suffi cient new revenues to move a poor person above Uganda’s poverty line. The analysis generally compares the economic value of a specifi c wetland product or service to the amount of shillings needed to move that person out of poverty. The following analysis integrates these different types of data and looks at one wetland use—papyrus harvesting. The main purpose is to show how the spatial analysis of poverty and wetland indicators can be strengthened with information from economic valuation studies. This analysis will estimate the quantity of papyrus that could be sustainably harvested in each subcounty (based on the area and location of papyrus wetlands), calculate the potential economic value that is associated with this harvest, and compare the potential papyrus revenue to the total amount of money needed to move all poor persons in that subcounty above the poverty line (see Box 1 for the defi nition of poverty used in this publication). The theoretical total annual potential papyrus harvest for all subcounties was calculated from detailed maps of papyrus wetlands (NFA, 1996). The total papyrus area for each subcounty was multiplied by the quantity of papyrus that could be sustainably harvested per year (400 bundles per hectare of papyrus wetland based on Karanja et al., 2001). It was assumed that all papyrus stems were accessible in the subcounty and that their quality was homogeneous and high enough to be harvested and sold. Map 11 (page 28) presents the total annual revenue that could be obtained from harvesting all papyrus areas in each subcounty. The potential revenue for each subcounty was obtained by multiplying the annual harvest quantity by its average sales price. The data are based on an economic study of papyrus harvest and sales in Pallisa District (Karanja et al., 2001) which determined an average sales price of 500 Uganda Shillings for each bundle of harvested papyrus. (This translates to an annual theoretical return of 200,000 Uganda Shillings per year for each hectare of papyrus wetland, equivalent to about US$ 118 per hectare per year with 1US$ = 1,700 Uganda Shillings.) Map 11 shows 444 subcounties without any papyrus revenues (areas in white). These subcounties have no papyrus wetlands and most of them are in the northern districts. Other subcounties without papyrus revenues are in southeast Uganda (Manafwa, Sironko, and Bukwo Districts), the southwestern highlands (parts of Bundibugyo, Kanungu, and Kasese Districts), and parts of Kiruhura and Lyantonde Districts. The other 514 subcounties have papyrus wetlands and could realize revenues from papyrus harvests (subcounties shown in shades of purple). The subcounties with the largest potential total annual papyrus revenues (shaded in dark purple) are in the districts of Buliisa, Nakaseke, Luwero, Kayunga, Kamuli, Pallisa, and How Spatial Analysis Can Benefit Wetlands and Reduce Poverty in Uganda