

Mapping a Better Future - World Resources Institute
Mapping a Better Future - World Resources Institute
Mapping a Better Future - World Resources Institute

Create successful ePaper yourself
Turn your PDF publications into a flip-book with our unique Google optimized e-Paper software.
Wetland Characteristics and Uses<br />
13<br />
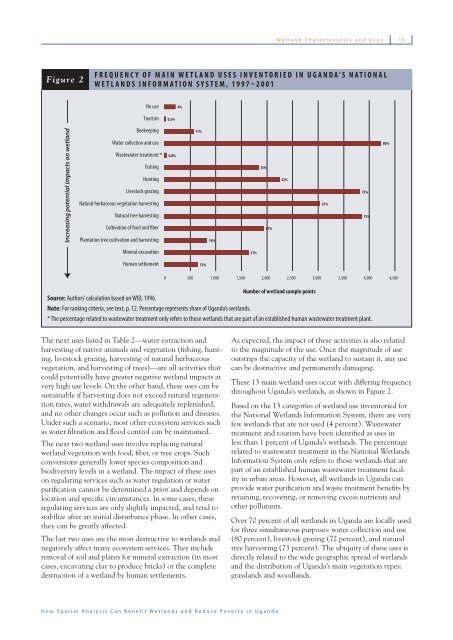
Figure 2<br />
FREQUENCY OF MAIN WETLAND USES INVENTORIED IN UGANDA’S NATIONAL<br />
WETLANDS INFORMATION SYSTEM, 1997–2001<br />
Source: Authors’ calculation based on WID, 1996.<br />
Note: For ranking criteria, see text, p. 12. Percentage represents share of Uganda’s wetlands.<br />
* The percentage related to wastewater treatment only refers to those wetlands that are part of an established human wastewater treatment plant.<br />
The next uses listed in Table 2—water extraction and<br />
harvesting of native animals and vegetation (fi shing, hunting,<br />
livestock grazing, harvesting of natural herbaceous<br />
vegetation, and harvesting of trees)—are all activities that<br />
could potentially have greater negative wetland impacts at<br />
very high use levels. On the other hand, these uses can be<br />
sustainable if harvesting does not exceed natural regeneration<br />
rates, water withdrawals are adequately replenished,<br />
and no other changes occur such as pollution and diseases.<br />
Under such a scenario, most other ecosystem services such<br />
as water fi ltration and fl ood control can be maintained.<br />
The next two wetland uses involve replacing natural<br />
wetland vegetation with food, fi ber, or tree crops. Such<br />
conversions generally lower species composition and<br />
biodiversity levels in a wetland. The impact of these uses<br />
on regulating services such as water regulation or water<br />
purifi cation cannot be determined a priori and depends on<br />
location and specifi c circumstances. In some cases, these<br />
regulating services are only slightly impacted, and tend to<br />
stabilize after an initial disturbance phase. In other cases,<br />
they can be greatly affected.<br />
The last two uses are the most destructive to wetlands and<br />
negatively affect many ecosystem services. They include<br />
removal of soil and plants for mineral extraction (in most<br />
cases, excavating clay to produce bricks) or the complete<br />
destruction of a wetland by human settlements.<br />
As expected, the impact of these activities is also related<br />
to the magnitude of the use. Once the magnitude of use<br />
outstrips the capacity of the wetland to sustain it, any use<br />
can be destructive and permanently damaging.<br />
These 13 main wetland uses occur with differing frequency<br />
throughout Uganda’s wetlands, as shown in Figure 2.<br />
Based on the 13 categories of wetland use inventoried for<br />
the National Wetlands Information System, there are very<br />
few wetlands that are not used (4 percent). Wastewater<br />
treatment and tourism have been identifi ed as uses in<br />
less than 1 percent of Uganda’s wetlands. The percentage<br />
related to wastewater treatment in the National Wetlands<br />
Information System only refers to those wetlands that are<br />
part of an established human wastewater treatment facility<br />
in urban areas. However, all wetlands in Uganda can<br />
provide water purifi cation and waste treatment benefi ts by<br />
retaining, recovering, or removing excess nutrients and<br />
other pollutants.<br />
Over 70 percent of all wetlands in Uganda are locally used<br />
for three simultaneous purposes: water collection and use<br />
(80 percent), livestock grazing (72 percent), and natural<br />
tree harvesting (73 percent). The ubiquity of these uses is<br />
directly related to the wide geographic spread of wetlands<br />
and the distribution of Uganda’s main vegetation types:<br />
grasslands and woodlands.<br />
How Spatial Analysis Can Benefit Wetlands and Reduce Poverty in Uganda


