ENVIRONMENTAL STATEMENT BARDOLINO DEVELOPMENT
ENVIRONMENTAL STATEMENT BARDOLINO DEVELOPMENT
ENVIRONMENTAL STATEMENT BARDOLINO DEVELOPMENT

Create successful ePaper yourself
Turn your PDF publications into a flip-book with our unique Google optimized e-Paper software.
Bardolino Development Environmental Statement<br />
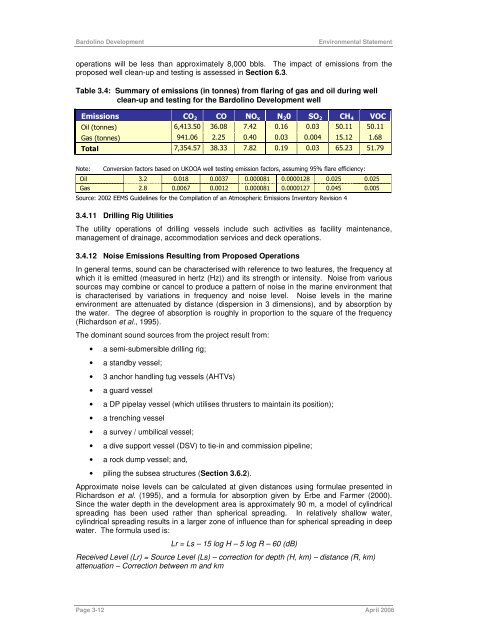
operations will be less than approximately 8,000 bbls. The impact of emissions from the<br />
proposed well clean-up and testing is assessed in Section 6.3.<br />
Table 3.4: Summary of emissions (in tonnes) from flaring of gas and oil during well<br />
clean-up and testing for the Bardolino Development well<br />
Emissions CO2 CO NOx N20 SO2 CH4 VOC<br />
Oil (tonnes) 6,413.50 36.08 7.42 0.16 0.03 50.11 50.11<br />
Gas (tonnes) 941.06 2.25 0.40 0.03 0.004 15.12 1.68<br />
Total 7,354.57 38.33 7.82 0.19 0.03 65.23 51.79<br />
Note: Conversion factors based on UKOOA well testing emission factors, assuming 95% flare efficiency:<br />
Oil 3.2 0.018 0.0037 0.000081 0.0000128 0.025 0.025<br />
Gas 2.8 0.0067 0.0012 0.000081 0.0000127 0.045 0.005<br />
Source: 2002 EEMS Guidelines for the Compilation of an Atmospheric Emissions Inventory Revision 4<br />
3.4.11 Drilling Rig Utilities<br />
The utility operations of drilling vessels include such activities as facility maintenance,<br />
management of drainage, accommodation services and deck operations.<br />
3.4.12 Noise Emissions Resulting from Proposed Operations<br />
In general terms, sound can be characterised with reference to two features, the frequency at<br />
which it is emitted (measured in hertz (Hz)) and its strength or intensity. Noise from various<br />
sources may combine or cancel to produce a pattern of noise in the marine environment that<br />
is characterised by variations in frequency and noise level. Noise levels in the marine<br />
environment are attenuated by distance (dispersion in 3 dimensions), and by absorption by<br />
the water. The degree of absorption is roughly in proportion to the square of the frequency<br />
(Richardson et al., 1995).<br />
The dominant sound sources from the project result from:<br />
• a semi-submersible drilling rig;<br />
• a standby vessel;<br />
• 3 anchor handling tug vessels (AHTVs)<br />
• a guard vessel<br />
• a DP pipelay vessel (which utilises thrusters to maintain its position);<br />
• a trenching vessel<br />
• a survey / umbilical vessel;<br />
• a dive support vessel (DSV) to tie-in and commission pipeline;<br />
• a rock dump vessel; and,<br />
• piling the subsea structures (Section 3.6.2).<br />
Approximate noise levels can be calculated at given distances using formulae presented in<br />
Richardson et al. (1995), and a formula for absorption given by Erbe and Farmer (2000).<br />
Since the water depth in the development area is approximately 90 m, a model of cylindrical<br />
spreading has been used rather than spherical spreading. In relatively shallow water,<br />
cylindrical spreading results in a larger zone of influence than for spherical spreading in deep<br />
water. The formula used is:<br />
Lr = Ls – 15 log H – 5 log R – 60 (dB)<br />
Received Level (Lr) = Source Level (Ls) – correction for depth (H, km) – distance (R, km)<br />
attenuation – Correction between m and km<br />
Page 3-12 April 2008

![Download Shell AutoGas Stationen [Stand: Januar 2013] (PDF](https://img.yumpu.com/9982753/1/190x245/download-shell-autogas-stationen-stand-januar-2013-pdf.jpg?quality=85)