guideline and standards for skytem measurements, processing and ...
guideline and standards for skytem measurements, processing and ...
guideline and standards for skytem measurements, processing and ...

Create successful ePaper yourself
Turn your PDF publications into a flip-book with our unique Google optimized e-Paper software.
as the time derivative of the current. When the wave<strong>for</strong>m is determined, the<br />
transmitter current shall have the same level as during production <strong>for</strong> the various<br />
moments. The wave<strong>for</strong>m shall be scalable to the transmitter current because<br />
minor wave<strong>for</strong>m fluctuations may occur during mapping, primarily due to<br />
temperature changes.<br />
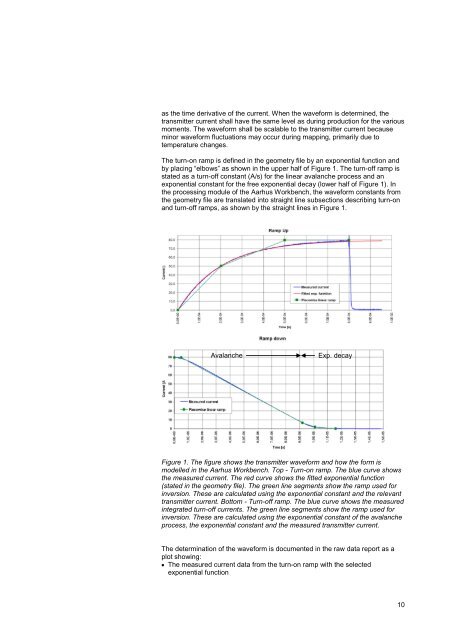
The turn-on ramp is defined in the geometry file by an exponential function <strong>and</strong><br />
by placing “elbows” as shown in the upper half of Figure 1. The turn-off ramp is<br />
stated as a turn-off constant (A/s) <strong>for</strong> the linear avalanche process <strong>and</strong> an<br />
exponential constant <strong>for</strong> the free exponential decay (lower half of Figure 1). In<br />
the <strong>processing</strong> module of the Aarhus Workbench, the wave<strong>for</strong>m constants from<br />
the geometry file are translated into straight line subsections describing turn-on<br />
<strong>and</strong> turn-off ramps, as shown by the straight lines in Figure 1.<br />
Avalanche<br />
Exp. decay<br />
Figure 1. The figure shows the transmitter wave<strong>for</strong>m <strong>and</strong> how the <strong>for</strong>m is<br />
modelled in the Aarhus Workbench. Top - Turn-on ramp. The blue curve shows<br />
the measured current. The red curve shows the fitted exponential function<br />
(stated in the geometry file). The green line segments show the ramp used <strong>for</strong><br />
inversion. These are calculated using the exponential constant <strong>and</strong> the relevant<br />
transmitter current. Bottom - Turn-off ramp. The blue curve shows the measured<br />
integrated turn-off currents. The green line segments show the ramp used <strong>for</strong><br />
inversion. These are calculated using the exponential constant of the avalanche<br />
process, the exponential constant <strong>and</strong> the measured transmitter current.<br />
The determination of the wave<strong>for</strong>m is documented in the raw data report as a<br />
plot showing:<br />
The measured current data from the turn-on ramp with the selected<br />
exponential function<br />
10