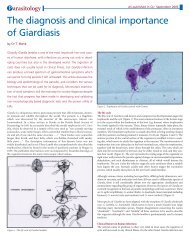
Screening for cancer: are biomarkers of value?
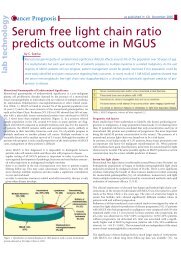
Screening for cancer: are biomarkers of value?
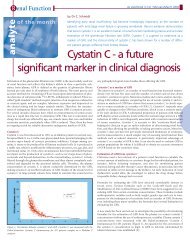
Screening for cancer: are biomarkers of value?

Create successful ePaper yourself
Turn your PDF publications into a flip-book with our unique Google optimized e-Paper software.
– February/March 2011 20 Tumour markers<br />
<strong>of</strong> pre-malignant MGUS and SMM cases<br />
that <strong>are</strong> diagnosed each year, it is important<br />
to have a strategy <strong>for</strong> managing<br />
“benign monoclonal gammopathies” versus<br />
“malignant monoclonal gammopathies”.<br />
A study <strong>of</strong> 1,384 MGUS cases from<br />
a South Eastern Minnesota, USA cohort<br />
demonstrated that 1% <strong>of</strong> MGUS patients<br />
progressed to myeloma per year, the size<br />
<strong>of</strong> the M-spike and heavy chain isotype<br />
being prognostic <strong>for</strong> progression [5]. This<br />
was extended to include a third factor –<br />
an abnormal serum free light chain ratio<br />
and a risk stratification model was developed<br />
that identified “very low risk MGUS<br />
patients” using low serum monoclonal<br />
protein levels, IgG isotype and a normal<br />
serum free light chain ratio [6]. These<br />
MGUS patients’ disease progression rate<br />
was 0.1% per year. Whilst not synonymous<br />
with a “normal case” it is consistent<br />
with placement at the benign end <strong>of</strong><br />
the monoclonal gammopathy disease<br />
spectrum. Conversely, MGUS patients at<br />
very high risk <strong>are</strong> starting to be identified;<br />
the risk is not necessarily high enough at<br />
presentation to warrant immediate treatment,<br />
but these patients <strong>are</strong> most likely to<br />
exhibit the clinical symptoms and signs<br />
required (i.e. by CRAB criteria) <strong>for</strong> a<br />
diagnosis <strong>of</strong> myeloma in the future.<br />
11-12% <strong>of</strong> MGUS patients<br />
undetected by a simplified<br />
screening panel <strong>of</strong> serum PEL and<br />
FLC: should we be concerned?<br />
If MGUS patients’ lab tests <strong>are</strong> negative with<br />
serum protein electrophoresis and free light<br />
chain assay, with a small M-spike and a normal<br />
free light chain ratio, thus there is no, or<br />
just one adverse prognostic factor, they <strong>are</strong><br />
placed in a low risk group. There is a very<br />
low probability <strong>of</strong> progressing to disease and<br />
it may be preferable that laboratorians and<br />
clinicians do not identify them. This avoids<br />
placing a psychological burden on patients<br />
and an economic strain on the healthc<strong>are</strong><br />
system. More incumbent is to examine why<br />
recommendations <strong>for</strong> monitoring these individuals<br />
<strong>are</strong> what they <strong>are</strong>. Our patients’ lifelong<br />
interests <strong>are</strong> probably better served if<br />
Assay<br />
Coefficient <strong>of</strong><br />
Variability<br />
Figure 2. Serum FLC terminology: involved, uninvolved<br />
and difference in free light chain derivation.<br />
their clinical symptoms and signs <strong>of</strong> disease<br />
<strong>are</strong> monitored in the community by their<br />
primary healthc<strong>are</strong> physician in the first<br />
instance, as opposed to extensive lab-based<br />
monitoring under the hospital out-patient<br />
c<strong>are</strong> <strong>of</strong> a haematologist.<br />
Monitoring<br />
The free light chain immunoassay is recommended<br />
<strong>for</strong> monitoring <strong>of</strong> oligosecretory<br />
PCD (AL, NSMM, LCDD), that is, those<br />
patients who do not have a measurable<br />
serum or plasma M-spike and <strong>for</strong> documenting<br />
a response to therapy [6,7]. The recommendation<br />
<strong>for</strong> what a partial response (PR)<br />
is in these oligosecretory PCD patients has<br />
been set at a 50% reduction in the involved<br />
free light chain or dFLC [Figure 2].<br />
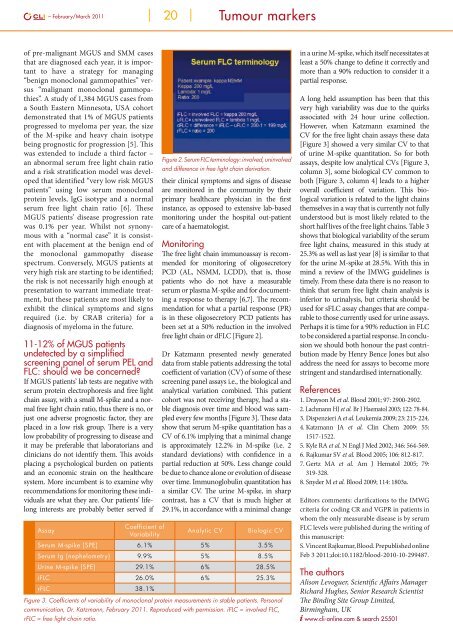
Dr Katzmann presented newly generated<br />
data from stable patients addressing the total<br />
coefficient <strong>of</strong> variation (CV) <strong>of</strong> some <strong>of</strong> these<br />
screening panel assays i.e., the biological and<br />
analytical variation combined. This patient<br />
cohort was not receiving therapy, had a stable<br />
diagnosis over time and blood was sampled<br />
every few months [Figure 3]. These data<br />
show that serum M-spike quantitation has a<br />
CV <strong>of</strong> 6.1% implying that a minimal change<br />
is approximately 12.2% in M-spike (i.e. 2<br />
standard deviations) with confidence in a<br />
partial reduction at 50%. Less change could<br />
be due to chance alone or evolution <strong>of</strong> disease<br />
over time. Immunoglobulin quantitation has<br />
a similar CV. The urine M-spike, in sharp<br />
contrast, has a CV that is much higher at<br />
29.1%, in accordance with a minimal change<br />
Analytic CV<br />
Biologic CV<br />
Serum M-spike [SPE] 6.1% 5% 3.5%<br />
Serum Ig [nephelometry] 9.9% 5% 8.5%<br />
Urine M-spike [SPE] 29.1% 6% 28.5%<br />
iFLC 26.0% 6% 25.3%<br />
rFLC 38.1%<br />
Figure 3. Coefficients <strong>of</strong> variability <strong>of</strong> monoclonal protein measurements in stable patients. Personal<br />
communication, Dr. Katzmann, February 2011. Reproduced with permission. iFLC = involved FLC,<br />
rFLC = free light chain ratio.<br />
in a urine M-spike, which itself necessitates at<br />
least a 50% change to define it correctly and<br />
more than a 90% reduction to consider it a<br />
partial response.<br />
A long held assumption has been that this<br />
very high variability was due to the quirks<br />
associated with 24 hour urine collection.<br />
However, when Katzmann examined the<br />
CV <strong>for</strong> the free light chain assays these data<br />
[Figure 3] showed a very similar CV to that<br />
<strong>of</strong> urine M-spike quantitation. So <strong>for</strong> both<br />
assays, despite low analytical CVs [Figure 3,<br />
column 3], some biological CV common to<br />
both [Figure 3, column 4] leads to a higher<br />
overall coefficient <strong>of</strong> variation. This biological<br />
variation is related to the light chains<br />
themselves in a way that is currently not fully<br />
understood but is most likely related to the<br />
short half lives <strong>of</strong> the free light chains. Table 3<br />
shows that biological variability <strong>of</strong> the serum<br />
free light chains, measured in this study at<br />
25.3% as well as last year [8] is similar to that<br />
<strong>for</strong> the urine M-spike at 28.5%. With this in<br />
mind a review <strong>of</strong> the IMWG guidelines is<br />
timely. From these data there is no reason to<br />
think that serum free light chain analysis is<br />
inferior to urinalysis, but criteria should be<br />
used <strong>for</strong> sFLC assay changes that <strong>are</strong> comparable<br />
to those currently used <strong>for</strong> urine assays.<br />
Perhaps it is time <strong>for</strong> a 90% reduction in FLC<br />
to be considered a partial response. In conclusion<br />
we should both honour the past contribution<br />
made by Henry Bence Jones but also<br />
address the need <strong>for</strong> assays to become more<br />
stringent and standardised internationally.<br />
References<br />
1. Drayson M et al. Blood 2001; 97: 2900-2902.<br />
2. Lachmann HJ et al. Br J Haematol 2003; 122: 78-84.<br />
3. Dispenzieri A et al. Leukemia 2009; 23: 215-224.<br />
4. Katzmann JA et al. Clin Chem 2009: 55:<br />
1517-1522.<br />
5. Kyle RA et al. N Engl J Med 2002; 346: 564-569.<br />
6. Rajkumar SV et al. Blood 2005; 106: 812-817.<br />
7. Gertz MA et al. Am J Hematol 2005; 79:<br />
319-328.<br />
8. Snyder M et al. Blood 2009; 114: 1803a.<br />
Editors comments: clarifications to the IMWG<br />
criteria <strong>for</strong> coding CR and VGPR in patients in<br />
whom the only measurable disease is by serum<br />
FLC levels were published during the writing <strong>of</strong><br />
this manuscript:<br />
S. Vincent Rajkumar, Blood. Prepublished online<br />
Feb 3 2011;doi:10.1182/blood-2010-10-299487.<br />
The authors<br />
Alison Levoguer, Scientific Affairs Manager<br />
Richard Hughes, Senior Research Scientist<br />
The Binding Site Group Limited,<br />
Birmingham, UK<br />
www.cli-online.com & search 25501