Thompson Creek Flood Study Report - City of Peterborough
Thompson Creek Flood Study Report - City of Peterborough
Thompson Creek Flood Study Report - City of Peterborough

You also want an ePaper? Increase the reach of your titles
YUMPU automatically turns print PDFs into web optimized ePapers that Google loves.
<strong>Thompson</strong> <strong>Creek</strong> Detailed <strong>Flood</strong> Reduction <strong>Study</strong><br />
<strong>City</strong> <strong>of</strong> <strong>Peterborough</strong><br />
Street<br />
Segment<br />
#<br />
Fig.<br />
4.3.1<br />
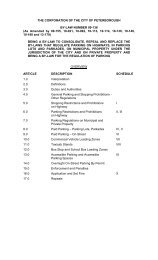
Table 4.6.3<br />
Depth <strong>of</strong> Water for 1 in 2 Year to 1 in 100 Year Storm in Moir Street Area<br />
2-Year<br />
1-hour AES<br />
Max. Max<br />
Flow Depth<br />
(m 3 /s) (mm)<br />
5-Year<br />
1-hour AES<br />
Max. Max<br />
Flow Depth<br />
(m 3 /s) (mm)<br />
10-Year<br />
1-hour AES<br />
Max. Max<br />
Flow Depth<br />
(m 3 /s) (mm)<br />
25-Year<br />
1-hour AES<br />
Max. Max<br />
Flow Depth<br />
(m 3 /s) (mm)<br />
50-Year<br />
1-hour AES<br />
Max. Max<br />
Flow Depth<br />
(m 3 /s) (mm)<br />
100-Year<br />
1-hour AES<br />
Max. Max<br />
Flow Depth<br />
(m 3 /s) (mm)<br />
2801 0.06 34 0.08 37 0.10 40 0.12 44 0.15 48 0.17 51<br />
2802 0.09 38 0.12 44 0.16 49 0.20 56 0.25 62 0.29 65<br />
2803 0.11 41 0.16 49 0.21 57 0.26 63 0.33 67 0.39 71<br />
2804 0.18 63 0.27 71 0.36 79 0.46 88 0.56 95 0.64 100<br />
2805 0.17 61 0.26 70 0.36 79 0.47 90 0.60 97 0.71 103<br />
2807 0.18 62 0.28 72 0.39 82 0.53 94 0.69 102 0.82 109<br />
2808 0.12 126 0.21 157 0.31 182 0.44 207 0.60 231 0.74 249<br />
2809 0.07 104 0.14 135 0.22 161 0.33 187 0.47 212 0.61 232<br />
2811 0.09 113 0.14 134 0.20 156 0.32 185 0.43 205 0.60 231<br />
2812 0.05 36 0.07 40 0.09 45 0.15 57 0.24 68 0.30 74<br />
2813 0.05 27 0.07 32 0.09 34 0.12 38 0.20 47 0.26 53<br />
2814 0.02 12 0.03 20 0.05 29 0.07 33 0.13 38 0.17 43<br />
6. Parkhill Road East system – this system also drains a small area <strong>of</strong> Armour<br />
Road to an outfall to the Otonabee River near the Parkhill Road bridge. No<br />
potential flooding is indicated by the OTTSWMM model within this system for<br />
the 1 in 2 year to 1 in 100 year storm.<br />
4.6.2.2 Volume Events for <strong>Flood</strong> Vulnerability Mapping<br />
Areas within <strong>Thompson</strong> <strong>Creek</strong> Watershed<br />
The following section discusses the results for the simulations <strong>of</strong> the 40 mm and 60 mm<br />
volume based events for the three separate storm sewer systems within the <strong>Thompson</strong><br />
<strong>Creek</strong> watershed. The results are generally very similar to those for the 1 in 2 year to 1<br />
in 100 year storm.<br />
Waverley Heights – flooding is indicated for the same two locations within the existing<br />
Waverley Heights subdivision described in Section 4.6.2.2. Table 4.6.4 shows the<br />
predicted depths <strong>of</strong> water for the 40 mm and 60 mm events for the two locations.<br />
14-06605-01-W01 <strong>City</strong> <strong>of</strong> <strong>Peterborough</strong> 82