FORM 10-K CONTANGO OIL & GAS COMPANY
FORM 10-K CONTANGO OIL & GAS COMPANY
FORM 10-K CONTANGO OIL & GAS COMPANY
Create successful ePaper yourself
Turn your PDF publications into a flip-book with our unique Google optimized e-Paper software.
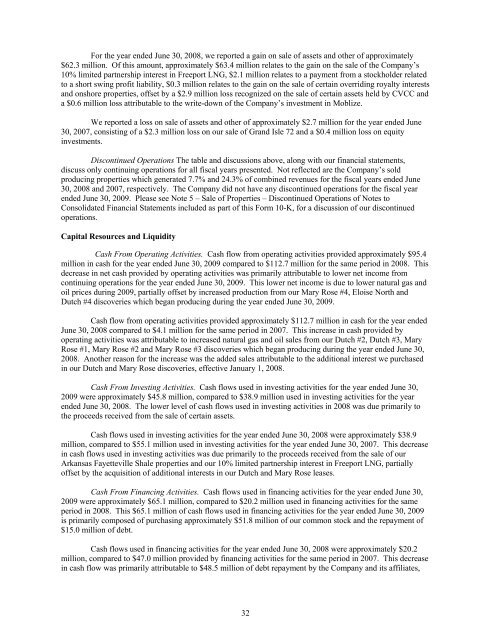
For the year ended June 30, 2008, we reported a gain on sale of assets and other of approximately<br />
$62.3 million. Of this amount, approximately $63.4 million relates to the gain on the sale of the Company’s<br />
<strong>10</strong>% limited partnership interest in Freeport LNG, $2.1 million relates to a payment from a stockholder related<br />
to a short swing profit liability, $0.3 million relates to the gain on the sale of certain overriding royalty interests<br />
and onshore properties, offset by a $2.9 million loss recognized on the sale of certain assets held by CVCC and<br />
a $0.6 million loss attributable to the write-down of the Company’s investment in Moblize.<br />
We reported a loss on sale of assets and other of approximately $2.7 million for the year ended June<br />
30, 2007, consisting of a $2.3 million loss on our sale of Grand Isle 72 and a $0.4 million loss on equity<br />
investments.<br />
Discontinued Operations The table and discussions above, along with our financial statements,<br />
discuss only continuing operations for all fiscal years presented. Not reflected are the Company’s sold<br />
producing properties which generated 7.7% and 24.3% of combined revenues for the fiscal years ended June<br />
30, 2008 and 2007, respectively. The Company did not have any discontinued operations for the fiscal year<br />
ended June 30, 2009. Please see Note 5 – Sale of Properties – Discontinued Operations of Notes to<br />
Consolidated Financial Statements included as part of this Form <strong>10</strong>-K, for a discussion of our discontinued<br />
operations.<br />
Capital Resources and Liquidity<br />
Cash From Operating Activities. Cash flow from operating activities provided approximately $95.4<br />
million in cash for the year ended June 30, 2009 compared to $112.7 million for the same period in 2008. This<br />
decrease in net cash provided by operating activities was primarily attributable to lower net income from<br />
continuing operations for the year ended June 30, 2009. This lower net income is due to lower natural gas and<br />
oil prices during 2009, partially offset by increased production from our Mary Rose #4, Eloise North and<br />
Dutch #4 discoveries which began producing during the year ended June 30, 2009.<br />
Cash flow from operating activities provided approximately $112.7 million in cash for the year ended<br />
June 30, 2008 compared to $4.1 million for the same period in 2007. This increase in cash provided by<br />
operating activities was attributable to increased natural gas and oil sales from our Dutch #2, Dutch #3, Mary<br />
Rose #1, Mary Rose #2 and Mary Rose #3 discoveries which began producing during the year ended June 30,<br />
2008. Another reason for the increase was the added sales attributable to the additional interest we purchased<br />
in our Dutch and Mary Rose discoveries, effective January 1, 2008.<br />
Cash From Investing Activities. Cash flows used in investing activities for the year ended June 30,<br />
2009 were approximately $45.8 million, compared to $38.9 million used in investing activities for the year<br />
ended June 30, 2008. The lower level of cash flows used in investing activities in 2008 was due primarily to<br />
the proceeds received from the sale of certain assets.<br />
Cash flows used in investing activities for the year ended June 30, 2008 were approximately $38.9<br />
million, compared to $55.1 million used in investing activities for the year ended June 30, 2007. This decrease<br />
in cash flows used in investing activities was due primarily to the proceeds received from the sale of our<br />
Arkansas Fayetteville Shale properties and our <strong>10</strong>% limited partnership interest in Freeport LNG, partially<br />
offset by the acquisition of additional interests in our Dutch and Mary Rose leases.<br />
Cash From Financing Activities. Cash flows used in financing activities for the year ended June 30,<br />
2009 were approximately $65.1 million, compared to $20.2 million used in financing activities for the same<br />
period in 2008. This $65.1 million of cash flows used in financing activities for the year ended June 30, 2009<br />
is primarily composed of purchasing approximately $51.8 million of our common stock and the repayment of<br />
$15.0 million of debt.<br />
Cash flows used in financing activities for the year ended June 30, 2008 were approximately $20.2<br />
million, compared to $47.0 million provided by financing activities for the same period in 2007. This decrease<br />
in cash flow was primarily attributable to $48.5 million of debt repayment by the Company and its affiliates,<br />
32


