FORM 10-K CONTANGO OIL & GAS COMPANY
FORM 10-K CONTANGO OIL & GAS COMPANY
FORM 10-K CONTANGO OIL & GAS COMPANY

Create successful ePaper yourself
Turn your PDF publications into a flip-book with our unique Google optimized e-Paper software.
<strong>CONTANGO</strong> <strong>OIL</strong> & <strong>GAS</strong> <strong>COMPANY</strong> AND SUBSIDIARIES<br />
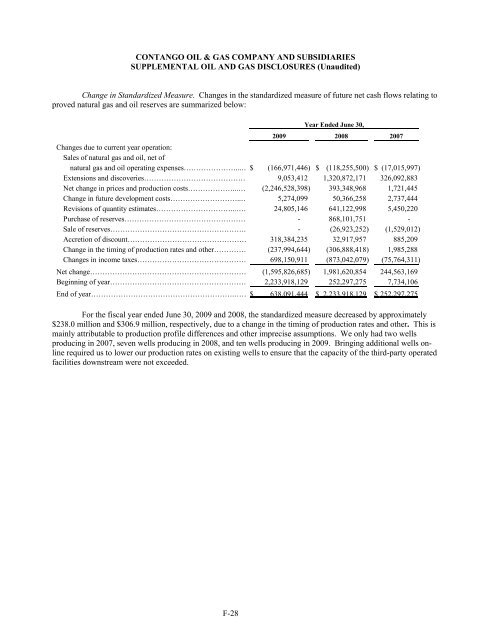
SUPPLEMENTAL <strong>OIL</strong> AND <strong>GAS</strong> DISCLOSURES (Unaudited)<br />
Change in Standardized Measure. Changes in the standardized measure of future net cash flows relating to<br />
proved natural gas and oil reserves are summarized below:<br />
Year Ended June 30,<br />
2009 2008 2007<br />
Changes due to current year operation:<br />
Sales of natural gas and oil, net of<br />
natural gas and oil operating expenses…………………...… $ (166,971,446) $ (118,255,500) $ (17,015,997)<br />
Extensions and discoveries…………………………………… 9,053,412 1,320,872,171 326,092,883<br />
Net change in prices and production costs………………...… (2,246,528,398) 393,348,968 1,721,445<br />
Change in future development costs………………………..… 5,274,099 50,366,258 2,737,444<br />
Revisions of quantity estimates…………………………...…… 24,805,146 641,122,998 5,450,220<br />
Purchase of reserves…………………………………………… - 868,<strong>10</strong>1,751 -<br />
Sale of reserves………………………………………………. - (26,923,252) (1,529,012)<br />
Accretion of discount………………………………………… 318,384,235 32,917,957 885,209<br />
Change in the timing of production rates and other…………… (237,994,644) (306,888,418) 1,985,288<br />
Changes in income taxes……………………………………… 698,150,911 (873,042,079) (75,764,311)<br />
Net change……………………………………………………… (1,595,826,685) 1,981,620,854 244,563,169<br />
Beginning of year………………………………………………… 2,233,918,129 252,297,275 7,734,<strong>10</strong>6<br />
End of year………………………………………………….…… $ 638,091,444 $ 2,233,918,129 $ 252,297,275<br />
For the fiscal year ended June 30, 2009 and 2008, the standardized measure decreased by approximately<br />
$238.0 million and $306.9 million, respectively, due to a change in the timing of production rates and other. This is<br />
mainly attributable to production profile differences and other imprecise assumptions. We only had two wells<br />
producing in 2007, seven wells producing in 2008, and ten wells producing in 2009. Bringing additional wells online<br />
required us to lower our production rates on existing wells to ensure that the capacity of the third-party operated<br />
facilities downstream were not exceeded.<br />
DB2/2<strong>10</strong>43537.7 F-28