Download PDF - Stockland
Download PDF - Stockland
Download PDF - Stockland

You also want an ePaper? Increase the reach of your titles
YUMPU automatically turns print PDFs into web optimized ePapers that Google loves.
CR&S 2010<br />
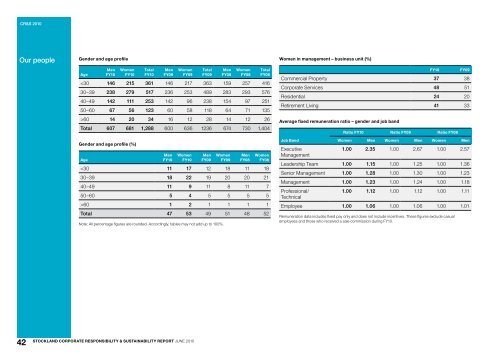
Our people<br />
Gender and age profile<br />
Women in management – business unit (%)<br />
Age<br />
Men<br />
FY10<br />
Women<br />
FY10<br />
Total<br />
FY10<br />
Men<br />
FY09<br />
Women<br />
FY09<br />
Total<br />
FY09<br />
Men<br />
FY08<br />
Women<br />
FY08<br />
Total<br />
FY08<br />
60 14 20 34 16 12 28 14 12 26<br />
Total 607 681 1,288 600 636 1236 674 730 1,404<br />
Gender and age profile (%)<br />
Age<br />
Men<br />
FY10<br />
Women<br />
FY10<br />
Men<br />
FY09<br />
Women<br />
FY09<br />
Men<br />
FY08<br />
Women<br />
FY08<br />
60 1 2 1 1 1 1<br />
Total 47 53 49 51 48 52<br />
Note: All percentage figures are rounded. Accordingly, tables may not add up to 100%.<br />
Commercial Property 37 38<br />
Corporate Services 48 51<br />
Residential 24 20<br />
Retirement Living 41 33<br />
Average fixed remuneration ratio – gender and job band<br />
FY10<br />
Ratio FY10 Ratio FY09 Ratio FY08<br />
Job Band Women Men Women Men Women Men<br />
Executive<br />
Management<br />
FY09<br />
1.00 2.35 1.00 2.67 1.00 2.57<br />
Leadership Team 1.00 1.15 1.00 1.25 1.00 1.36<br />
Senior Management 1.00 1.28 1.00 1.30 1.00 1.23<br />
Management 1.00 1.23 1.00 1.24 1.00 1.18<br />
Professional/<br />
Technical<br />
1.00 1.12 1.00 1.12 1.00 1.11<br />
Employee 1.00 1.06 1.00 1.06 1.00 1.01<br />
Remuneration data includes fixed pay only and does not include incentives. These figures exclude casual<br />
employees and those who received a sale commission during FY10.<br />
42<br />
<strong>Stockland</strong> Corporate Responsibility & Sustainability Report June 2010