Quantitative analysis of EEG signals: Time-frequency methods and ...
Quantitative analysis of EEG signals: Time-frequency methods and ...
Quantitative analysis of EEG signals: Time-frequency methods and ...
You also want an ePaper? Increase the reach of your titles
YUMPU automatically turns print PDFs into web optimized ePapers that Google loves.
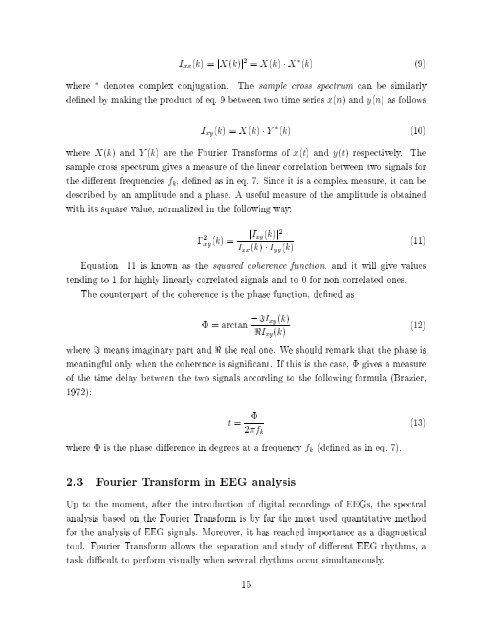
I xx (k) =jX(k)j 2 = X(k) X (k) (9)<br />
where denotes complex conjugation. The sample cross spectrum can be similarly<br />
dened by making the product <strong>of</strong> eq. 9 between two time series x(n) <strong>and</strong>y(n) as follows<br />
I xy (k) =X(k) Y (k) (10)<br />
where X(k) <strong>and</strong> Y (k) are the Fourier Transforms <strong>of</strong> x(t) <strong>and</strong> y(t) respectively. The<br />
sample cross spectrum gives a measure <strong>of</strong> the linear correlation between two <strong>signals</strong> for<br />
the dierent frequencies f k , dened as in eq. 7. Since it is a complex measure, it can be<br />
described by an amplitude <strong>and</strong> a phase. A useful measure <strong>of</strong> the amplitude is obtained<br />
with its square value, normalized in the following way:<br />
; 2 xy(k) =<br />
jI xy (k)j 2<br />
I xx (k) I yy (k)<br />
(11)<br />
Equation 11 is known as the squared coherence function, <strong>and</strong> it will give values<br />
tending to 1 for highly linearly correlated <strong>signals</strong> <strong>and</strong> to 0 for non correlated ones.<br />
The counterpart <strong>of</strong> the coherence is the phase function, dened as<br />
= arctan ;=I xy(k)<br />


