

Quantitative analysis of EEG signals: Time-frequency methods and ...
Quantitative analysis of EEG signals: Time-frequency methods and ...
Quantitative analysis of EEG signals: Time-frequency methods and ...

Create successful ePaper yourself
Turn your PDF publications into a flip-book with our unique Google optimized e-Paper software.
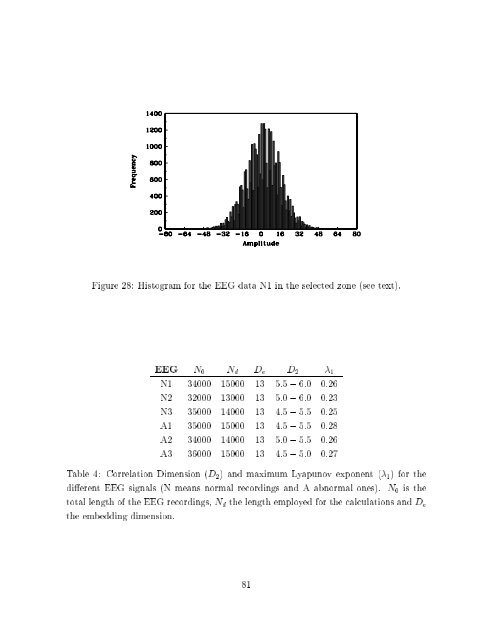
Figure 28: Histogram for the <strong>EEG</strong> data N1 in the selected zone (see text).<br />
<strong>EEG</strong> N 0 N d D e D 2 1<br />
N1 34000 15000 13 5:5 ; 6:0 0:26<br />
N2 32000 13000 13 5:0 ; 6:0 0:23<br />
N3 35000 14000 13 4:5 ; 5:5 0:25<br />
A1 35000 15000 13 4:5 ; 5:5 0:28<br />
A2 34000 14000 13 5:0 ; 5:5 0:26<br />
A3 36000 15000 13 4:5 ; 5:0 0:27<br />
Table 4: Correlation Dimension (D 2 ) <strong>and</strong> maximum Lyapunov exponent ( 1 ) for the<br />
dierent <strong>EEG</strong> <strong>signals</strong> (N means normal recordings <strong>and</strong> A abnormal ones). N 0<br />
is the<br />
total length <strong>of</strong> the <strong>EEG</strong> recordings, N d the length employed for the calculations <strong>and</strong> D e<br />
the embedding dimension.<br />
81

