

Quantitative analysis of EEG signals: Time-frequency methods and ...
Quantitative analysis of EEG signals: Time-frequency methods and ...
Quantitative analysis of EEG signals: Time-frequency methods and ...

You also want an ePaper? Increase the reach of your titles
YUMPU automatically turns print PDFs into web optimized ePapers that Google loves.
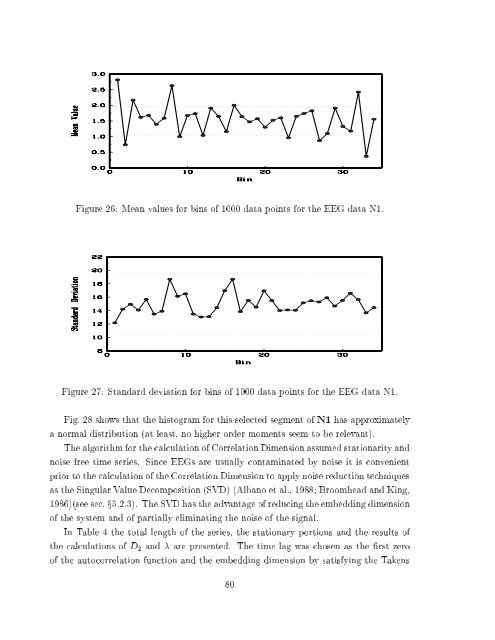
Figure 26: Mean values for bins <strong>of</strong> 1000 data points for the <strong>EEG</strong> data N1.<br />
Figure 27: St<strong>and</strong>ard deviation for bins <strong>of</strong> 1000 data points for the <strong>EEG</strong> data N1.<br />
Fig. 28 shows that the histogram for this selected segment <strong>of</strong>N1 has approximately<br />
a normal distribution (at least, no higher order moments seem to be relevant).<br />
The algorithm for the calculation <strong>of</strong> Correlation Dimension assumed stationarity <strong>and</strong><br />
noise free time series. Since <strong>EEG</strong>s are usually contaminated by noise it is convenient<br />
prior to the calculation <strong>of</strong> the Correlation Dimension to apply noise reduction techniques<br />
as the Singular Value Decomposition (SVD) (Albano et al., 1988 Broomhead <strong>and</strong> King,<br />
1986)(see sec. x5.2.3). The SVD has the advantage <strong>of</strong> reducing the embedding dimension<br />
<strong>of</strong> the system <strong>and</strong> <strong>of</strong> partially eliminating the noise<strong>of</strong>thesignal.<br />
In Table 4 the total length <strong>of</strong> the series, the stationary portions <strong>and</strong> the results <strong>of</strong><br />
the calculations <strong>of</strong> D 2 <strong>and</strong> are presented. The time lag was chosen as the rst zero<br />
<strong>of</strong> the autocorrelation function <strong>and</strong> the embedding dimension by satisfying the Takens<br />
80

