Investment Policy Review - Rwanda - UNCTAD Virtual Institute
Investment Policy Review - Rwanda - UNCTAD Virtual Institute
Investment Policy Review - Rwanda - UNCTAD Virtual Institute

Create successful ePaper yourself
Turn your PDF publications into a flip-book with our unique Google optimized e-Paper software.
<strong>Investment</strong> <strong>Policy</strong> <strong>Review</strong> of <strong>Rwanda</strong><br />
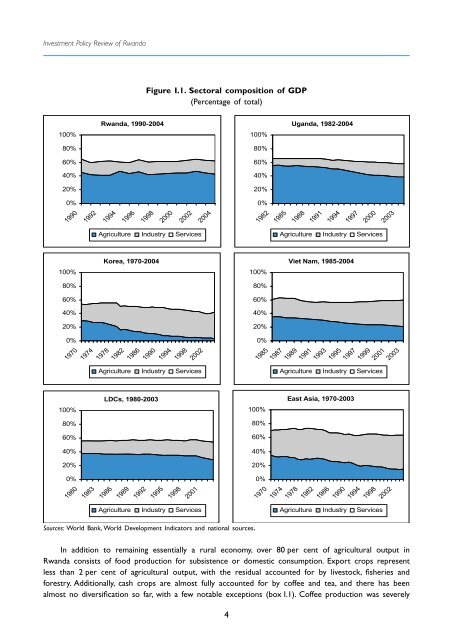
Figure I.1. Sectoral composition of GDP<br />
(Percentage of total)<br />
<strong>Rwanda</strong>, 1990-2004<br />
Uganda, 1982-2004<br />
100%<br />
100%<br />
80%<br />
80%<br />
60%<br />
60%<br />
40%<br />
40%<br />
20%<br />
20%<br />
0%<br />
0%<br />
1990<br />
1992<br />
1994<br />
1996<br />
1998<br />
2000<br />
2002<br />
2004<br />
1982<br />
1985<br />
1988<br />
1991<br />
1994<br />
1997<br />
2000<br />
2003<br />
Agriculture Industry Services<br />
Agriculture Industry Services<br />
Korea, 1970-2004<br />
Viet Nam, 1985-2004<br />
100%<br />
100%<br />
80%<br />
80%<br />
60%<br />
40%<br />
20%<br />
0%<br />
100%<br />
1970<br />
1974<br />
1978<br />
1982<br />
1986<br />
1990<br />
1994<br />
1998<br />
2002<br />
Agriculture Industry Services<br />
LDCs, 1980-2003<br />
60%<br />
40%<br />
20%<br />
0%<br />
100%<br />
1985<br />
1987<br />
1989<br />
1991<br />
1993<br />
1995<br />
1997<br />
1999<br />
2001<br />
2003<br />
Agriculture Industry Services<br />
East Asia, 1970-2003<br />
80%<br />
80%<br />
60%<br />
40%<br />
20%<br />
0%<br />
1980<br />
1983<br />
1986<br />
1989<br />
1992<br />
1995<br />
1998<br />
2001<br />
Agriculture Industry Services<br />
Sources: World Bank, World Development Indicators and national sources.<br />
4<br />
60%<br />
40%<br />
20%<br />
0%<br />
1970<br />
1974<br />
1978<br />
1982<br />
1986<br />
1990<br />
1994<br />
1998<br />
2002<br />
Agriculture Industry Services<br />
In addition to remaining essentially a rural economy, over 80 per cent of agricultural output in<br />
<strong>Rwanda</strong> consists of food production for subsistence or domestic consumption. Export crops represent<br />
less than 2 per cent of agricultural output, with the residual accounted for by livestock, fisheries and<br />
forestry. Additionally, cash crops are almost fully accounted for by coffee and tea, and there has been<br />
almost no diversification so far, with a few notable exceptions (box I.1). Coffee production was severely