Investment Policy Review - Rwanda - UNCTAD Virtual Institute
Investment Policy Review - Rwanda - UNCTAD Virtual Institute
Investment Policy Review - Rwanda - UNCTAD Virtual Institute

You also want an ePaper? Increase the reach of your titles
YUMPU automatically turns print PDFs into web optimized ePapers that Google loves.
<strong>Investment</strong> <strong>Policy</strong> <strong>Review</strong> of <strong>Rwanda</strong><br />
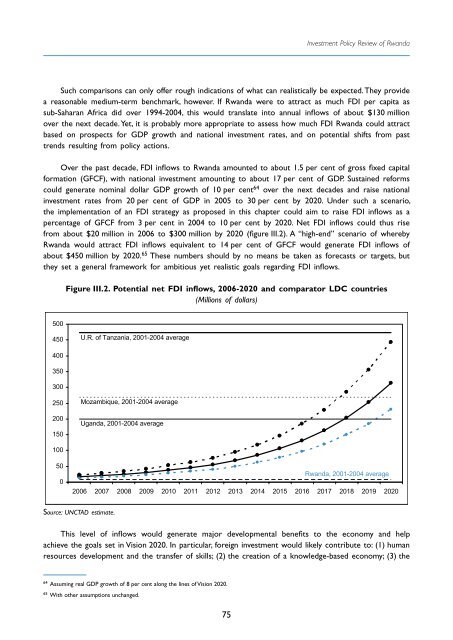
Such comparisons can only offer rough indications of what can realistically be expected. They provide<br />
a reasonable medium-term benchmark, however. If <strong>Rwanda</strong> were to attract as much FDI per capita as<br />
sub-Saharan Africa did over 1994-2004, this would translate into annual inflows of about $130 million<br />
over the next decade. Yet, it is probably more appropriate to assess how much FDI <strong>Rwanda</strong> could attract<br />
based on prospects for GDP growth and national investment rates, and on potential shifts from past<br />
trends resulting from policy actions.<br />
Over the past decade, FDI inflows to <strong>Rwanda</strong> amounted to about 1.5 per cent of gross fixed capital<br />
formation (GFCF), with national investment amounting to about 17 per cent of GDP. Sustained reforms<br />
could generate nominal dollar GDP growth of 10 per cent 64 over the next decades and raise national<br />
investment rates from 20 per cent of GDP in 2005 to 30 per cent by 2020. Under such a scenario,<br />
the implementation of an FDI strategy as proposed in this chapter could aim to raise FDI inflows as a<br />
percentage of GFCF from 3 per cent in 2004 to 10 per cent by 2020. Net FDI inflows could thus rise<br />
from about $20 million in 2006 to $300 million by 2020 (figure III.2). A “high-end” scenario of whereby<br />
<strong>Rwanda</strong> would attract FDI inflows equivalent to 14 per cent of GFCF would generate FDI inflows of<br />
about $450 million by 2020. 65 These numbers should by no means be taken as forecasts or targets, but<br />
they set a general framework for ambitious yet realistic goals regarding FDI inflows.<br />
Figure III.2. Potential net FDI inflows, 2006-2020 and comparator LDC countries<br />
(Millions of dollars)<br />
500<br />
450<br />
U.R. of Tanzania, 2001-2004 average<br />
400<br />
350<br />
300<br />
250<br />
200<br />
150<br />
Mozambique, 2001-2004 average<br />
Uganda, 2001-2004 average<br />
100<br />
50<br />
0<br />
<strong>Rwanda</strong>, 2001-2004 average<br />
2006 2007 2008 2009 2010 2011 2012 2013 2014 2015 2016 2017 2018 2019 2020<br />
Source: <strong>UNCTAD</strong> estimate.<br />
This level of inflows would generate major developmental benefits to the economy and help<br />
achieve the goals set in Vision 2020. In particular, foreign investment would likely contribute to: (1) human<br />
resources development and the transfer of skills; (2) the creation of a knowledge-based economy; (3) the<br />
64<br />
Assuming real GDP growth of 8 per cent along the lines of Vision 2020.<br />
65<br />
With other assumptions unchanged.<br />
75