Community - GolfBusiness
Community - GolfBusiness
Community - GolfBusiness

Create successful ePaper yourself
Turn your PDF publications into a flip-book with our unique Google optimized e-Paper software.
Industry Pulse<br />
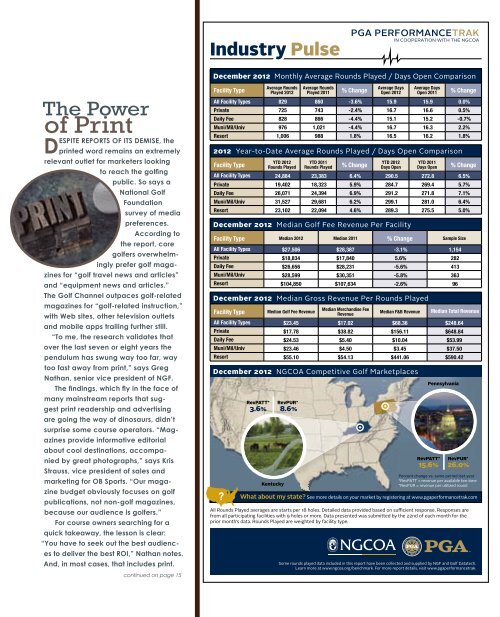
December 2012 Monthly Average Rounds Played / Days Open Comparison<br />
The Power<br />
of Print<br />
D<br />
ESPITE REPORTS OF ITS DEMISE, the<br />
printed word remains an extremely<br />
relevant outlet for marketers looking<br />
to reach the golfing<br />
public. So says a<br />
National Golf<br />
Foundation<br />
survey of media<br />
preferences.<br />
According to<br />
the report, core<br />
golfers overwhelmingly<br />
prefer golf magazines<br />
for “golf travel news and articles”<br />
and “equipment news and articles.”<br />
The Golf Channel outpaces golf-related<br />
magazines for “golf-related instruction,”<br />
with Web sites, other television outlets<br />
and mobile apps trailing further still.<br />
“To me, the research validates that<br />
over the last seven or eight years the<br />
pendulum has swung way too far, way<br />
too fast away from print,” says Greg<br />
Nathan, senior vice president of NGF.<br />
The findings, which fly in the face of<br />
many mainstream reports that suggest<br />
print readership and advertising<br />
are going the way of dinosaurs, didn’t<br />
surprise some course operators. “Magazines<br />
provide informative editorial<br />
about cool destinations, accompanied<br />
by great photographs,” says Kris<br />
Strauss, vice president of sales and<br />
marketing for OB Sports. “Our magazine<br />
budget obviously focuses on golf<br />
publications, not non-golf magazines,<br />
because our audience is golfers.”<br />
For course owners searching for a<br />
quick takeaway, the lesson is clear:<br />
“You have to seek out the best audiences<br />
to deliver the best ROI,” Nathan notes.<br />
And, in most cases, that includes print.<br />
continued on page 15<br />
Facility Type<br />
% Change<br />
% Change<br />
Average Rounds Average Rounds<br />
Average Days Average Days<br />
Played 2012 Played 2011<br />
Open 2012 Open 2011<br />
All Facility Types 829 860 -3.6% 15.9 15.9 0.0%<br />
Private 725 743 -2.4% 16.7 16.6 0.5%<br />
Daily Fee 828 866 -4.4% 15.1 15.2 -0.7%<br />
Muni/Mil/Univ 976 1,021 -4.4% 16.7 16.3 2.2%<br />
Resort 1,006 988 1.8% 16.5 16.2 1.8%<br />
2012 Year-to-Date Average Rounds Played / Days Open Comparison<br />
Facility Type<br />
% Change<br />
% Change<br />
YTD 2012<br />
YTD 2011<br />
YTD 2012<br />
YTD 2011<br />
Rounds Played Rounds Played<br />
Days Open Days Open<br />
All Facility Types 24,884 23,383 6.4% 290.5 272.8 6.5%<br />
Private 19,402 18,323 5.9% 284.7 269.4 5.7%<br />
Daily Fee 26,071 24,394 6.9% 291.2 271.8 7.1%<br />
Muni/Mil/Univ 31,527 29,681 6.2% 299.1 281.0 6.4%<br />
Resort 23,102 22,094 4.6% 289.3 275.5 5.0%<br />
December 2012 Median Golf Fee Revenue Per Facility<br />
Facility Type Median 2012 Median 2011 % Change Sample Size<br />
All Facility Types $27,506 $28,387 -3.1% 1,154<br />
Private $18,834 $17,840 5.6% 282<br />
Daily Fee $26,656 $28,231 -5.6% 413<br />
Muni/Mil/Univ $28,599 $30,351 -5.8% 363<br />
Resort $104,850 $107,634 -2.6% 96<br />
December 2012 Median Gross Revenue Per Rounds Played<br />
Median Merchandise Fee<br />
Facility Type<br />
Median Golf Fee Revenue<br />
Median F&B Revenue<br />
Revenue<br />
Median Total Revenue<br />
All Facility Types $23.45 $17.02 $68.36 $248.64<br />
Private $17.78 $38.82 $156.11 $648.84<br />
Daily Fee $24.53 $5.40 $10.04 $53.99<br />
Muni/Mil/Univ $23.46 $4.50 $3.45 $37.50<br />
Resort $55.10 $54.13 $441.06 $590.42<br />
December 2012 NGCOA Competitive Golf Marketplaces<br />
RevPATT*<br />
3.6%<br />
Kentucky<br />
RevPUR*<br />
8.6%<br />
Pennsylvania<br />
RevPATT*<br />
RevPUR*<br />
15.6% 26.0%<br />
Percent change vs. same period last year<br />
*RevPATT = revenue per available tee-time<br />
*RevPUR = revenue per utilized round<br />
What about my state See more details on your market by registering at www.pgaperformancetrak.com<br />
All Rounds Played averages are starts per 18 holes. Detailed data provided based on sufficient response. Responses are<br />
from all participating facilities with 9 holes or more. Data presented was submitted by the 22nd of each month for the<br />
prior month’s data. Rounds Played are weighted by facility type.<br />
Some rounds played data included in this report have been collected and supplied by NGF and Golf Datatech.<br />
Learn more at www.ngcoa.org/benchmark. For more report details, visit www.pgaperformancetrak.