Community - GolfBusiness
Community - GolfBusiness
Community - GolfBusiness

Create successful ePaper yourself
Turn your PDF publications into a flip-book with our unique Google optimized e-Paper software.
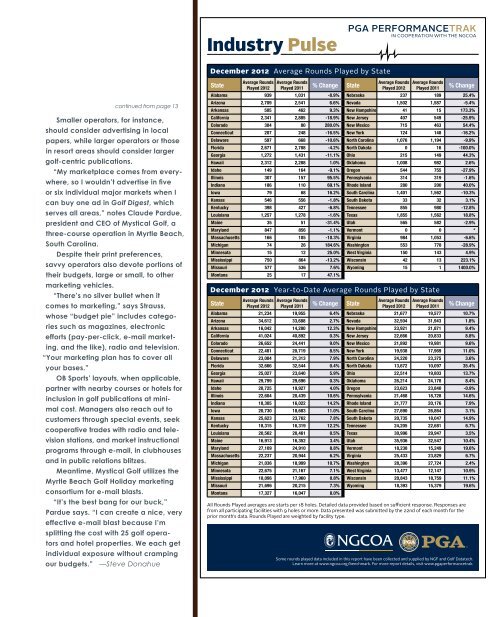
Industry Pulse<br />
December 2012 Average Rounds Played by State<br />
continued from page 13<br />
Smaller operators, for instance,<br />
should consider advertising in local<br />
papers, while larger operators or those<br />
in resort areas should consider larger<br />
golf-centric publications.<br />
“My marketplace comes from everywhere,<br />
so I wouldn’t advertise in five<br />
or six individual major markets when I<br />
can buy one ad in Golf Digest, which<br />
serves all areas,” notes Claude Pardue,<br />
president and CEO of Mystical Golf, a<br />
three-course operation in Myrtle Beach,<br />
South Carolina.<br />
Despite their print preferences,<br />
savvy operators also devote portions of<br />
their budgets, large or small, to other<br />
marketing vehicles.<br />
“There’s no silver bullet when it<br />
comes to marketing,” says Strauss,<br />
whose “budget pie” includes categories<br />
such as magazines, electronic<br />
efforts (pay-per-click, e-mail marketing,<br />
and the like), radio and television.<br />
“Your marketing plan has to cover all<br />
your bases.”<br />
OB Sports’ layouts, when applicable,<br />
partner with nearby courses or hotels for<br />
inclusion in golf publications at minimal<br />
cost. Managers also reach out to<br />
customers through special events, seek<br />
cooperative trades with radio and television<br />
stations, and market instructional<br />
programs through e-mail, in clubhouses<br />
and in public relations blitzes.<br />
Meantime, Mystical Golf utilizes the<br />
Myrtle Beach Golf Holiday marketing<br />
consortium for e-mail blasts.<br />
“It’s the best bang for our buck,”<br />
Pardue says. “I can create a nice, very<br />
effective e-mail blast because I’m<br />
splitting the cost with 25 golf operators<br />
and hotel properties. We each get<br />
individual exposure without cramping<br />
our budgets.” —Steve Donahue<br />
State<br />
Average Rounds Average Rounds<br />
Played 2011 % Change State<br />
Played 2012<br />
Average Rounds<br />
Played 2012<br />
Average Rounds<br />
Played 2011<br />
% Change<br />
Alabama 939 1,031 -8.9% Nebraska 237 189 25.4%<br />
Arizona 2,709 2,541 6.6% Nevada 1,502 1,587 -5.4%<br />
Arkansas 505 462 9.3% New Hampshire 41 15 173.3%<br />
California 2,341 2,885 -18.9% New Jersey 407 549 -25.9%<br />
Colorado 304 80 280.0% New Mexico 715 463 54.4%<br />
Connecticut 207 248 -16.5% New York 124 148 -16.2%<br />
Delaware 597 668 -10.6% North Carolina 1,076 1,194 -9.9%<br />
Florida 2,671 2,788 -4.2% North Dakota 0 16 -100.0%<br />
Georgia 1,272 1,431 -11.1% Ohio 215 149 44.3%<br />
Hawaii 2,312 2,288 1.0% Oklahoma 1,008 982 2.6%<br />
Idaho 149 164 -9.1% Oregon 544 755 -27.9%<br />
Illinois 307 157 95.5% Pennsylvania 314 319 -1.6%<br />
Indiana 186 110 69.1% Rhode Island 280 200 40.0%<br />
Iowa 79 68 16.2% South Carolina 1,401 1,562 -10.3%<br />
Kansas 546 556 -1.8% South Dakota 33 32 3.1%<br />
Kentucky 398 427 -6.8% Tennessee 855 980 -12.8%<br />
Louisiana 1,257 1,278 -1.6% Texas 1,855 1,562 18.8%<br />
Maine 35 51 -31.4% Utah 565 582 -2.9%<br />
Maryland 847 856 -1.1% Vermont 0 0 *<br />
Massachusetts 166 185 -10.3% Virginia 984 1,053 -6.6%<br />
Michigan 74 26 184.6% Washington 553 778 -28.9%<br />
Minnesota 15 12 25.0% West Virginia 150 143 4.9%<br />
Mississippi 750 864 -13.2% Wisconsin 42 13 223.1%<br />
Missouri 577 536 7.6% Wyoming 15 1 1400.0%<br />
Montana 25 17 47.1%<br />
December 2012 Year-to-Date Average Rounds Played by State<br />
State<br />
Average Rounds Average Rounds<br />
Played 2011 % Change State<br />
Played 2012<br />
Average Rounds<br />
Played 2012<br />
Average Rounds<br />
Played 2011<br />
% Change<br />
Alabama 21,234 19,955 6.4% Nebraska 21,677 19,577 10.7%<br />
Arizona 34,612 33,688 2.7% Nevada 32,504 31,943 1.8%<br />
Arkansas 16,042 14,280 12.3% New Hampshire 23,921 21,871 9.4%<br />
California 41,024 40,892 0.3% New Jersey 22,666 20,833 8.8%<br />
Colorado 26,652 24,441 9.0% New Mexico 21,892 19,981 9.6%<br />
Connecticut 22,481 20,719 8.5% New York 19,938 17,969 11.0%<br />
Delaware 23,004 21,313 7.9% North Carolina 24,220 23,375 3.6%<br />
Florida 32,666 32,544 0.4% North Dakota 13,672 10,097 35.4%<br />
Georgia 25,027 23,640 5.9% Ohio 22,514 19,803 13.7%<br />
Hawaii 29,799 29,696 0.3% Oklahoma 26,214 24,178 8.4%<br />
Idaho 20,725 19,927 4.0% Oregon 23,623 23,840 -0.9%<br />
Illinois 22,604 20,439 10.6% Pennsylvania 21,468 18,728 14.6%<br />
Indiana 18,305 16,022 14.2% Rhode Island 21,777 20,176 7.9%<br />
Iowa 20,730 18,683 11.0% South Carolina 27,690 26,864 3.1%<br />
Kansas 25,623 23,762 7.8% South Dakota 20,735 18,047 14.9%<br />
Kentucky 18,315 16,319 12.2% Tennessee 24,205 22,681 6.7%<br />
Louisiana 20,562 20,461 0.5% Texas 30,996 29,947 3.5%<br />
Maine 16,913 16,352 3.4% Utah 35,936 32,547 10.4%<br />
Maryland 27,109 24,910 8.8% Vermont 18,238 15,249 19.6%<br />
Massachusetts 22,237 20,944 6.2% Virginia 25,433 23,829 6.7%<br />
Michigan 21,036 18,999 10.7% Washington 28,396 27,724 2.4%<br />
Minnesota 22,675 21,167 7.1% West Virginia 13,477 12,147 10.9%<br />
Mississippi 18,096 17,960 0.8% Wisconsin 20,843 18,759 11.1%<br />
Missouri 21,696 20,215 7.3% Wyoming 18,393 15,379 19.6%<br />
Montana 17,327 16,047 8.0%<br />
All Rounds Played averages are starts per 18 holes. Detailed data provided based on sufficient response. Responses are<br />
from all participating facilities with 9 holes or more. Data presented was submitted by the 22nd of each month for the<br />
prior month’s data. Rounds Played are weighted by facility type.<br />
Some rounds played data included in this report have been collected and supplied by NGF and Golf Datatech.<br />
Learn more at www.ngcoa.org/benchmark. For more report details, visit www.pgaperformancetrak.