Infrastructure Projects Facility Technical Assistance Window (IPF TA ...
Infrastructure Projects Facility Technical Assistance Window (IPF TA ...
Infrastructure Projects Facility Technical Assistance Window (IPF TA ...

You also want an ePaper? Increase the reach of your titles
YUMPU automatically turns print PDFs into web optimized ePapers that Google loves.
<strong>Infrastructure</strong> <strong>Projects</strong> <strong>Facility</strong> – <strong>Technical</strong> <strong>Assistance</strong> <strong>Window</strong><br />
Sub project: WB4-MNE-ENV-12B: Management Models and Options for Cost Recovery for the Future Construction and<br />
Operation of Regional Landfills in Montenegro<br />
44<br />
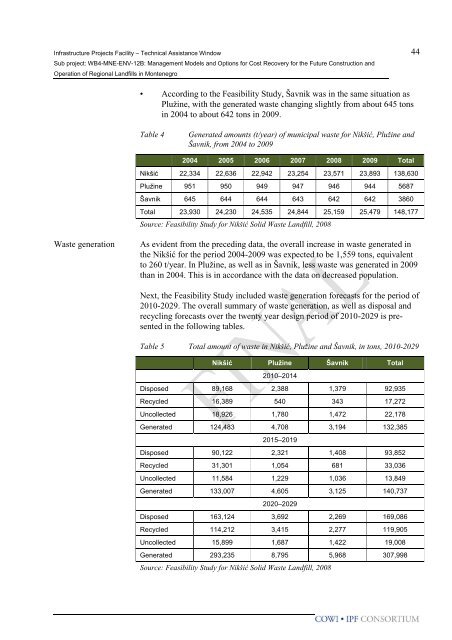
• According to the Feasibility Study, Šavnik was in the same situation as<br />
Pluţine, with the generated waste changing slightly from about 645 tons<br />
in 2004 to about 642 tons in 2009.<br />
Table 4<br />
Generated amounts (t/year) of municipal waste for Nikšić, Plužine and<br />
Šavnik, from 2004 to 2009<br />
2004 2005 2006 2007 2008 2009 Total<br />
Nikšić 22,334 22,636 22,942 23,254 23,571 23,893 138,630<br />
Plužine 951 950 949 947 946 944 5687<br />
Šavnik 645 644 644 643 642 642 3860<br />
Total 23,930 24,230 24,535 24,844 25,159 25,479 148,177<br />
Source: Feasibility Study for Nikšić Solid Waste Landfill, 2008<br />
Waste generation<br />
As evident from the preceding data, the overall increase in waste generated in<br />
the Nikšić for the period 2004-2009 was expected to be 1,559 tons, equivalent<br />
to 260 t/year. In Pluţine, as well as in Šavnik, less waste was generated in 2009<br />
than in 2004. This is in accordance with the data on decreased population.<br />
Next, the Feasibility Study included waste generation forecasts for the period of<br />
2010-2029. The overall summary of waste generation, as well as disposal and<br />
recycling forecasts over the twenty year design period of 2010-2029 is presented<br />
in the following tables.<br />
Table 5 Total amount of waste in Nikšić, Plužine and Šavnik, in tons, 2010-2029<br />
Nikšić Plužine Šavnik Total<br />
2010–2014<br />
Disposed 89,168 2,388 1,379 92,935<br />
Recycled 16,389 540 343 17,272<br />
Uncollected 18,926 1,780 1,472 22,178<br />
Generated 124,483 4,708 3,194 132,385<br />
2015–2019<br />
Disposed 90,122 2,321 1,408 93,852<br />
Recycled 31,301 1,054 681 33,036<br />
Uncollected 11,584 1,229 1,036 13,849<br />
Generated 133,007 4,605 3,125 140,737<br />
2020–2029<br />
Disposed 163,124 3,692 2,269 169,086<br />
Recycled 114,212 3,415 2,277 119,905<br />
Uncollected 15,899 1,687 1,422 19,008<br />
Generated 293,235 8,795 5,968 307,998<br />
Source: Feasibility Study for Nikšić Solid Waste Landfill, 2008<br />
.