

Electric Power Monthly February 2012 - EIA
Electric Power Monthly February 2012 - EIA
Electric Power Monthly February 2012 - EIA

You also want an ePaper? Increase the reach of your titles
YUMPU automatically turns print PDFs into web optimized ePapers that Google loves.
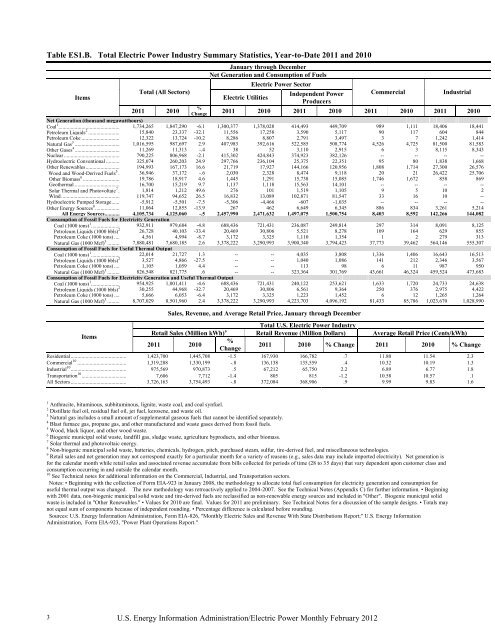
Table ES1.B. Total <strong>Electric</strong> <strong>Power</strong> Industry Summary Statistics, Year-to-Date 2011 and 2010<br />
3<br />
January through December<br />
Net Generation and Consumption of Fuels<br />
<strong>Electric</strong> <strong>Power</strong> Sector<br />
Items<br />
Total (All Sectors)<br />
<strong>Electric</strong> Utilities<br />
Independent <strong>Power</strong><br />
Producers<br />
Commercial Industrial<br />
2011<br />
Net Generation (thousand megawatthours)<br />
2010<br />
%<br />
Change 2011 2010 2011 2010 2011 2010 2011 2010<br />
Coal 1 .................................................... 1,734,265 1,847,290 -6.1 1,300,377 1,378,028 414,493 449,709 989 1,111 18,406 18,441<br />
Petroleum Liquids 2 .............................. 15,840 23,337 -32.1 11,556 17,258 3,590 5,117 90 117 604 844<br />
Petroleum Coke ................................... 12,322 13,724 -10.2 8,286 8,807 2,791 3,497 3 7 1,242 1,414<br />
Natural Gas 3 ........................................ 1,016,595 987,697 2.9 407,983 392,616 522,585 508,774 4,526 4,725 81,500 81,583<br />
Other Gases 4 ........................................ 11,269 11,313 -.4 38 52 3,110 2,915 6 3 8,115 8,343<br />
Nuclear ................................................ 790,225 806,968 -2.1 415,302 424,843 374,923 382,126 -- -- -- --<br />
Hydroelectric Conventional ................. 325,074 260,203 24.9 297,766 236,104 25,375 22,351 95 80 1,838 1,668<br />
Other Renewables ................................ 194,993 167,173 16.6 21,719 17,927 144,166 120,956 1,808 1,714 27,300 26,576<br />
Wood and Wood-Derived Fuels 5 ........ 36,946 37,172 -.6 2,030 2,328 8,474 9,118 20 21 26,422 25,706<br />
Other Biomass 6 .................................. 19,786 18,917 4.6 1,445 1,291 15,738 15,085 1,746 1,672 858 869<br />
Geothermal ........................................ 16,700 15,219 9.7 1,137 1,118 15,563 14,101 -- -- -- --<br />
Solar Thermal and Photovoltaic 7 ........ 1,814 1,212 49.6 276 101 1,519 1,105 9 5 10 2<br />
Wind .................................................. 119,747 94,652 26.5 16,832 13,089 102,871 81,547 33 16 10 --<br />
Hydroelectric Pumped Storage............. -5,912 -5,501 -7.5 -5,306 -4,466 -607 -1,035 -- -- -- --<br />
Other Energy Sources 8 ......................... 11,064 12,855 -13.9 267 462 6,649 6,345 886 834 3,261 5,214<br />
All Energy Sources.................. 4,105,734 4,125,060 -.5 2,457,990 2,471,632 1,497,075 1,500,754 8,403 8,592 142,266 144,082<br />
Consumption of Fossil Fuels for <strong>Electric</strong>ity Generation<br />
Coal (1000 tons) 1 ............................ 932,911 979,684 -4.8 688,436 721,431 236,087 249,814 297 314 8,091 8,125<br />
Petroleum Liquids (1000 bbls) 2 ...... 26,728 40,103 -33.4 20,469 30,806 5,521 8,278 109 164 629 855<br />
Petroleum Coke (1000 tons) ........... 4,561 4,994 -8.7 3,172 3,325 1,110 1,354 1 2 279 313<br />
Natural Gas (1000 Mcf) 3 ................ 7,880,481 7,680,185 2.6 3,378,222 3,290,993 3,900,340 3,794,423 37,773 39,462 564,146 555,307<br />
Consumption of Fossil Fuels for Useful Thermal Output<br />
Coal (1000 tons) 1 ............................ 22,014 21,727 1.3 -- -- 4,035 3,808 1,336 1,406 16,643 16,513<br />
Petroleum Liquids (1000 bbls) 2 ...... 3,527 4,866 -27.5 -- -- 1,040 1,086 141 212 2,346 3,567<br />
Petroleum Coke (1000 tons) ........... 1,105 1,059 4.4 -- -- 113 98 6 11 987 950<br />
Natural Gas (1000 Mcf) 3 ................ 826,548 821,775 .6 -- -- 323,364 301,769 43,661 46,324 459,524 473,683<br />
Consumption of Fossil Fuels for <strong>Electric</strong>ity Generation and Useful Thermal Output<br />
Coal (1000 tons) 1 ............................ 954,925 1,001,411 -4.6 688,436 721,431 240,122 253,621 1,633 1,720 24,733 24,638<br />
Petroleum Liquids (1000 bbls) 2 ...... 30,255 44,968 -32.7 20,469 30,806 6,561 9,364 250 376 2,975 4,422<br />
Petroleum Coke (1000 tons) ........... 5,666 6,053 -6.4 3,172 3,325 1,223 1,452 6 12 1,265 1,264<br />
Natural Gas (1000 Mcf) 3 ................ 8,707,029 8,501,960 2.4 3,378,222 3,290,993 4,223,703 4,096,192 81,433 85,786 1,023,670 1,028,990<br />
Sales, Revenue, and Average Retail Price, January through December<br />
Items<br />
Retail Sales (Million kWh)<br />
Total U.S. <strong>Electric</strong> <strong>Power</strong> Industry<br />
9 %<br />
2011 2010<br />
Change<br />
Retail Revenue (Million Dollars)<br />
2011 2010 % Change<br />
Average Retail Price (Cents/kWh)<br />
2011 2010 % Change<br />
Residential ......................................... 1,423,700 1,445,708 -1.5 167,930 166,782 .7 11.80 11.54 2.3<br />
Commercial 10 .................................... 1,319,288 1,330,199 -.8 136,138 135,559 .4 10.32 10.19 1.3<br />
Industrial 10 ......................................... 975,569 970,873 .5 67,212 65,750 2.2 6.89 6.77 1.8<br />
Transportation 10 ................................. 7,606 7,712 -1.4 805 815 -1.2 10.58 10.57 .1<br />
All Sectors ......................................... 3,726,163 3,754,493 -.8 372,084 368,906 .9 9.99 9.83 1.6<br />
1 Anthracite, bituminous, subbituminous, lignite, waste coal, and coal synfuel.<br />
2 Distillate fuel oil, residual fuel oil, jet fuel, kerosene, and waste oil.<br />
3 Natural gas includes a small amount of supplemental gaseous fuels that cannot be identified separately.<br />
4 Blast furnace gas, propane gas, and other manufactured and waste gases derived from fossil fuels.<br />
5 Wood, black liquor, and other wood waste.<br />
6 Biogenic municipal solid waste, landfill gas, sludge waste, agriculture byproducts, and other biomass.<br />
7 Solar thermal and photovoltaic energy.<br />
8 Non-biogenic municipal solid waste, batteries, chemicals, hydrogen, pitch, purchased steam, sulfur, tire-derived fuel, and miscellaneous technologies.<br />
9 Retail sales and net generation may not correspond exactly for a particular month for a variety of reasons (e.g., sales data may include imported electricity). Net generation is<br />
for the calendar month while retail sales and associated revenue accumulate from bills collected for periods of time (28 to 35 days) that vary dependent upon customer class and<br />
consumption occurring in and outside the calendar month.<br />
10 See Technical notes for additional information on the Commercial, Industrial, and Transportation sectors.<br />
Notes: • Beginning with the collection of Form <strong>EIA</strong>-923 in January 2008, the methodology to allocate total fuel consumption for electricity generation and consumption for<br />
useful thermal output was changed. The new methodology was retroactively applied to 2004-2007. See the Technical Notes (Appendix C) for further information. • Beginning<br />
with 2001 data, non-biogenic municipal solid waste and tire-derived fuels are reclassified as non-renewable energy sources and included in "Other". Biogenic municipal solid<br />
waste is included in "Other Renewables." • Values for 2010 are final. Values for 2011 are preliminary. See Technical Notes for a discussion of the sample designs. • Totals may<br />
not equal sum of components because of independent rounding. • Percentage difference is calculated before rounding.<br />
Sources: U.S. Energy Information Administration, Form <strong>EIA</strong>-826, "<strong>Monthly</strong> <strong>Electric</strong> Sales and Revenue With State Distributions Report;" U.S. Energy Information<br />
Administration, Form <strong>EIA</strong>-923, "<strong>Power</strong> Plant Operations Report."<br />
U.S. Energy Information Administration/<strong>Electric</strong> <strong>Power</strong> <strong>Monthly</strong> <strong>February</strong> <strong>2012</strong>


