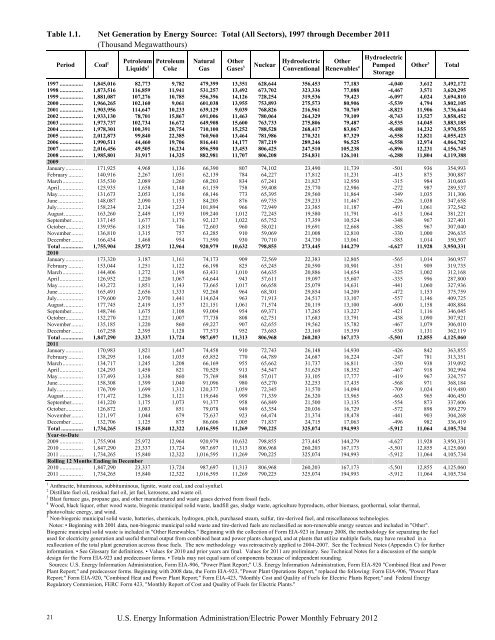
Table 1.1. Net Generation by Energy Source: Total (All Sectors), 1997 through December 2011 (Thousand Megawatthours) 21 Period Coal 1 Petroleum Liquids 2 Petroleum Coke Natural Gas Other Gases 3 Hydroelectric Nuclear Conventional Other Renewables 4 U.S. Energy Information Administration/<strong>Electric</strong> <strong>Power</strong> <strong>Monthly</strong> <strong>February</strong> <strong>2012</strong> Hydroelectric Pumped Storage Other 5 Total 1997 ................ 1,845,016 82,773 9,782 479,399 13,351 628,644 356,453 77,183 -4,040 3,612 3,492,172 1998 ................ 1,873,516 116,859 11,941 531,257 13,492 673,702 323,336 77,088 -4,467 3,571 3,620,295 1999 ................ 1,881,087 107,276 10,785 556,396 14,126 728,254 319,536 79,423 -6,097 4,024 3,694,810 2000 ................ 1,966,265 102,160 9,061 601,038 13,955 753,893 275,573 80,906 -5,539 4,794 3,802,105 2001 ................ 1,903,956 114,647 10,233 639,129 9,039 768,826 216,961 70,769 -8,823 11,906 3,736,644 2002 ................ 1,933,130 78,701 15,867 691,006 11,463 780,064 264,329 79,109 -8,743 13,527 3,858,452 2003 ................ 1,973,737 102,734 16,672 649,908 15,600 763,733 275,806 79,487 -8,535 14,045 3,883,185 2004 ................ 1,978,301 100,391 20,754 710,100 15,252 788,528 268,417 83,067 -8,488 14,232 3,970,555 2005 ................ 2,012,873 99,840 22,385 760,960 13,464 781,986 270,321 87,329 -6,558 12,821 4,055,423 2006 ................ 1,990,511 44,460 19,706 816,441 14,177 787,219 289,246 96,525 -6,558 12,974 4,064,702 2007 ................ 2,016,456 49,505 16,234 896,590 13,453 806,425 247,510 105,238 -6,896 12,231 4,156,745 2008 ................ 1,985,801 31,917 14,325 882,981 11,707 806,208 254,831 126,101 -6,288 11,804 4,119,388 2009 January ............ 171,925 4,968 1,136 66,390 807 74,102 23,490 11,739 -501 936 354,993 <strong>February</strong> .......... 140,916 2,267 1,051 62,139 784 64,227 17,812 11,231 -413 875 300,887 March .............. 135,530 2,089 1,260 68,203 834 67,241 21,827 12,950 -315 984 310,603 April ................ 125,935 1,658 1,148 61,159 758 59,408 25,770 12,986 -272 987 289,537 May ................. 131,673 2,053 1,156 68,146 773 65,395 29,560 11,864 -349 1,035 311,306 June ................. 148,087 2,090 1,153 84,205 876 69,735 29,233 11,467 -226 1,038 347,658 July .................. 158,234 2,124 1,234 101,894 966 72,949 23,385 11,187 -491 1,061 372,542 August ............. 163,260 2,449 1,193 109,240 1,012 72,245 19,580 11,791 -613 1,064 381,221 September........ 137,145 1,677 1,176 92,127 1,022 65,752 17,359 10,524 -348 967 327,401 October ............ 139,956 1,815 746 72,603 960 58,021 19,691 12,668 -385 967 307,040 November ........ 136,810 1,315 757 63,285 910 59,069 21,008 12,810 -330 1,000 296,635 December ........ 166,434 1,468 954 71,590 930 70,710 24,730 13,061 -383 1,014 350,507 Total ............... 1,755,904 25,972 12,964 920,979 10,632 798,855 273,445 144,279 -4,627 11,928 3,950,331 2010 January ............ 173,320 3,187 1,161 74,173 909 72,569 22,383 12,805 -565 1,014 360,957 <strong>February</strong> .......... 153,044 1,251 1,122 66,198 825 65,245 20,590 10,901 -351 909 319,735 March .............. 144,406 1,272 1,198 63,431 1,010 64,635 20,886 14,654 -325 1,002 312,168 April ................ 126,952 1,220 1,067 64,644 943 57,611 19,097 15,607 -335 996 287,800 May ................. 143,272 1,851 1,143 73,665 1,017 66,658 25,079 14,631 -441 1,060 327,936 June ................. 165,491 2,656 1,333 92,268 964 68,301 29,854 14,209 -472 1,153 375,759 July .................. 179,600 2,970 1,441 114,624 963 71,913 24,517 13,107 -557 1,146 409,725 August ............. 177,745 2,419 1,157 121,151 1,061 71,574 20,119 13,100 -600 1,158 408,884 September........ 148,746 1,675 1,108 93,004 954 69,371 17,265 13,227 -421 1,116 346,045 October ............ 132,270 1,221 1,007 77,738 808 62,751 17,683 13,791 -438 1,090 307,921 November ........ 135,185 1,220 860 69,227 907 62,655 19,562 15,782 -467 1,079 306,010 December ........ 167,258 2,395 1,128 77,573 952 73,683 23,169 15,359 -530 1,131 362,119 Total ............... 1,847,290 23,337 13,724 987,697 11,313 806,968 260,203 167,173 -5,501 12,855 4,125,060 2011 January ............ 170,983 1,821 1,447 74,458 910 72,743 26,148 14,930 -426 842 363,855 <strong>February</strong> .......... 138,295 1,166 1,035 65,852 770 64,789 24,687 16,224 -247 781 313,351 March .............. 134,717 1,245 1,208 66,169 955 65,662 31,737 16,811 -350 938 319,092 April ................ 124,293 1,458 821 70,529 913 54,547 31,629 18,352 -467 918 302,994 May ................. 137,493 1,338 860 75,769 848 57,017 33,105 17,777 -419 967 324,757 June ................. 158,308 1,399 1,040 91,096 980 65,270 32,253 17,435 -568 971 368,184 July .................. 176,709 1,699 1,312 120,377 1,059 72,345 31,570 14,094 -709 1,024 419,480 August ............. 171,472 1,286 1,121 119,646 999 71,339 26,320 13,965 -663 965 406,450 September........ 141,220 1,175 1,073 91,377 958 66,849 21,500 13,135 -554 873 337,606 October ............ 126,872 1,083 851 79,078 949 63,354 20,036 16,729 -572 898 309,279 November ........ 121,197 1,044 679 75,637 923 64,474 21,374 18,478 -441 903 304,268 December ........ 132,706 1,125 875 86,606 1,005 71,837 24,715 17,063 -496 982 336,419 Total ............... 1,734,265 15,840 12,322 1,016,595 11,269 790,225 325,074 194,993 -5,912 11,064 4,105,734 Year-to-Date 2009 ................ 1,755,904 25,972 12,964 920,979 10,632 798,855 273,445 144,279 -4,627 11,928 3,950,331 2010 ................ 1,847,290 23,337 13,724 987,697 11,313 806,968 260,203 167,173 -5,501 12,855 4,125,060 2011 ................ 1,734,265 15,840 12,322 1,016,595 11,269 790,225 325,074 194,993 -5,912 11,064 4,105,734 Rolling 12 Months Ending in December 2010 ................ 1,847,290 23,337 13,724 987,697 11,313 806,968 260,203 167,173 -5,501 12,855 4,125,060 2011 ................ 1,734,265 15,840 12,322 1,016,595 11,269 790,225 325,074 194,993 -5,912 11,064 4,105,734 1 Anthracite, bituminous, subbituminous, lignite, waste coal, and coal synfuel. 2 Distillate fuel oil, residual fuel oil, jet fuel, kerosene, and waste oil. 3 Blast furnace gas, propane gas, and other manufactured and waste gases derived from fossil fuels. 4 Wood, black liquor, other wood waste, biogenic municipal solid waste, landfill gas, sludge waste, agriculture byproducts, other biomass, geothermal, solar thermal, photovoltaic energy, and wind. 5 Non-biogenic municipal solid waste, batteries, chemicals, hydrogen, pitch, purchased steam, sulfur, tire-derived fuel, and miscellaneous technologies. Notes: • Beginning with 2001 data, non-biogenic municipal solid waste and tire-derived fuels are reclassified as non-renewable energy sources and included in "Other". Biogenic municipal solid waste is included in "Other Renewables." Beginning with the collection of Form <strong>EIA</strong>-923 in January 2008, the methodology for separating the fuel used for electricity generation and useful thermal output from combined heat and power plants changed, and at plants that utilize multiple fuels, may have resulted in a reallocation of the total plant generation accross those fuels. The new methodology was retroacitvely applied to 2004-2007. See the Technical Notes (Appendix C) for further information. • See Glossary for definitions. • Values for 2010 and prior years are final. Values for 2011 are preliminary. See Technical Notes for a discussion of the sample design for the Form <strong>EIA</strong>-923 and predecessor forms. • Totals may not equal sum of components because of independent rounding. Sources: U.S. Energy Information Administration, Form <strong>EIA</strong>-906, "<strong>Power</strong> Plant Report;" U.S. Energy Information Administration, Form <strong>EIA</strong>-920 "Combined Heat and <strong>Power</strong> Plant Report;" and predecessor forms. Beginning with 2008 data, the Form <strong>EIA</strong>-923, "<strong>Power</strong> Plant Operations Report," replaced the following: Form <strong>EIA</strong>-906, "<strong>Power</strong> Plant Report;" Form <strong>EIA</strong>-920, "Combined Heat and <strong>Power</strong> Plant Report;" Form <strong>EIA</strong>-423, "<strong>Monthly</strong> Cost and Quality of Fuels for <strong>Electric</strong> Plants Report;" and Federal Energy Regulatory Commission, FERC Form 423, "<strong>Monthly</strong> Report of Cost and Quality of Fuels for <strong>Electric</strong> Plants."
Table 1.1.A. Net Generation by Other Renewables: Total (All Sectors), 1997 through December 2011 (Thousand Megawatthours) Period Wind Solar Thermal and Photovoltaic Wood and Wood-Derived Fuels 1 Geothermal Other Biomass 2 U.S. Energy Information Administration/<strong>Electric</strong> <strong>Power</strong> <strong>Monthly</strong> <strong>February</strong> <strong>2012</strong> Total (Other Renewables) 1997 ............................................. 3,288 511 36,948 14,726 21,709 77,183 1998 ............................................. 3,026 502 36,338 14,774 22,448 77,088 1999 ............................................. 4,488 495 37,041 14,827 22,572 79,423 2000 ............................................. 5,593 493 37,595 14,093 23,131 80,906 2001 ............................................. 6,737 543 35,200 13,741 14,548 70,769 2002 ............................................. 10,354 555 38,665 14,491 15,044 79,109 2003 ............................................. 11,187 534 37,529 14,424 15,812 79,487 2004 ............................................. 14,144 575 38,117 14,811 15,421 83,067 2005 ............................................. 17,811 550 38,856 14,692 15,420 87,329 2006 ............................................. 26,589 508 38,762 14,568 16,099 96,525 2007 ............................................. 34,450 612 39,014 14,637 16,525 105,238 2008 ............................................. 55,363 864 37,300 14,840 17,734 126,101 2009 January ......................................... 5,951 7 3,030 1,289 1,462 11,739 <strong>February</strong> ....................................... 5,852 30 2,823 1,168 1,357 11,231 March ........................................... 7,099 78 2,919 1,300 1,553 12,950 April ............................................. 7,458 99 2,664 1,222 1,542 12,986 May .............................................. 6,262 110 2,735 1,235 1,522 11,864 June .............................................. 5,599 103 2,997 1,209 1,558 11,467 July ............................................... 4,955 121 3,227 1,255 1,628 11,187 August .......................................... 5,464 116 3,355 1,251 1,604 11,791 September..................................... 4,651 95 3,061 1,217 1,501 10,524 October ......................................... 6,814 68 3,032 1,221 1,533 12,668 November ..................................... 6,875 40 3,049 1,273 1,572 12,810 December ..................................... 6,906 21 3,158 1,368 1,608 13,061 Total ............................................ 73,886 891 36,050 15,009 18,443 144,279 2010 January ......................................... 6,854 10 3,126 1,312 1,503 12,805 <strong>February</strong> ....................................... 5,432 33 2,895 1,159 1,382 10,901 March ........................................... 8,589 76 3,090 1,307 1,592 14,654 April ............................................. 9,764 112 2,932 1,240 1,558 15,607 May .............................................. 8,698 153 2,893 1,311 1,577 14,631 June .............................................. 8,049 176 3,094 1,264 1,627 14,209 July ............................................... 6,724 161 3,308 1,274 1,640 13,107 August .......................................... 6,686 156 3,319 1,297 1,642 13,100 September..................................... 7,106 138 3,157 1,253 1,575 13,227 October ......................................... 7,944 75 3,003 1,222 1,547 13,791 November ..................................... 9,748 77 3,080 1,252 1,625 15,782 December ..................................... 9,059 44 3,275 1,330 1,650 15,359 Total ............................................ 94,652 1,212 37,172 15,219 18,917 167,173 2011 January ......................................... 8,659 31 3,258 1,478 1,503 14,930 <strong>February</strong> ....................................... 10,528 80 2,896 1,326 1,393 16,224 March ........................................... 10,537 113 3,041 1,465 1,655 16,811 April ............................................. 12,447 161 2,788 1,337 1,619 18,352 May .............................................. 11,635 201 2,802 1,438 1,702 17,777 June .............................................. 10,887 257 3,243 1,363 1,685 17,435 July ............................................... 7,382 226 3,348 1,372 1,767 14,094 August .......................................... 7,342 236 3,290 1,380 1,717 13,965 September..................................... 6,883 183 3,113 1,334 1,621 13,135 October ......................................... 10,623 169 2,876 1,393 1,669 16,729 November ..................................... 12,354 78 2,980 1,377 1,689 18,478 December ..................................... 10,469 79 3,311 1,439 1,765 17,063 Total ............................................ 119,747 1,814 36,946 16,700 19,786 194,993 Year-to-Date 2009 ............................................. 73,886 891 36,050 15,009 18,443 144,279 2010 ............................................. 94,652 1,212 37,172 15,219 18,917 167,173 2011 ............................................. 119,747 1,814 36,946 16,700 19,786 194,993 Rolling 12 Months Ending in December 2010 ............................................. 94,652 1,212 37,172 15,219 18,917 167,173 2011 ............................................. 119,747 1,814 36,946 16,700 19,786 194,993 1 Wood/wood waste solids (including paper pellets, railroad ties, utility poles, wood chips, bark, and wood waste solids), wood waste liquids (red liquor, sludge wood, spent sulfite liquor, and other wood-based liquids), and black liquor. 2 Biogenic municipal solid waste, landfill gas, sludge waste, agricultural byproducts, other biomass solids, other biomass liquids, and other biomass gases (including digester gases, methane, and other biomass gases). Notes: • Beginning with 2001 data, non-biogenic municipal solid waste and tire-derived fuels are reclassified as non-renewable energy sources and included in "Other". Biogenic municipal solid waste is included in "Other Renewables." • Beginning with the collection of Form <strong>EIA</strong>-923 in January 2008, the methodology to allocate total fuel consumption for electricity generation and consumption for useful thermal output was changed. The new methodology was retroactively applied to 2004-2007. See the Technical Notes (Appendix C) for further information. • See Glossary for definitions. • Values for 2010 and prior years are final. Values for 2011 are preliminary. • Totals may not equal sum of components because of independent rounding. Sources: U.S. Energy Information Administration, Form <strong>EIA</strong>-906, "<strong>Power</strong> Plant Report;" U.S. Energy Information Administration, Form <strong>EIA</strong>-920 "Combined Heat and <strong>Power</strong> Plant Report;" and predecessor forms. Beginning with 2008 data, the Form <strong>EIA</strong>-923, "<strong>Power</strong> Plant Operations Report," replaced the following: Form <strong>EIA</strong>-906, "<strong>Power</strong> Plant Report;" Form <strong>EIA</strong>-920, "Combined Heat and <strong>Power</strong> Plant Report;" Form <strong>EIA</strong>-423, "<strong>Monthly</strong> Cost and Quality of Fuels for <strong>Electric</strong> Plants Report;" and Federal Energy Regulatory Commission, FERC Form 423, "<strong>Monthly</strong> Report of Cost and Quality of Fuels for <strong>Electric</strong> Plants." 22
- Page 1 and 2: Electric Power Monthly February 201
- Page 3 and 4: The Electric Power Monthly (EPM) pr
- Page 5 and 6: Table Index Executive Summary .....
- Page 7 and 8: Table 3.4. Stocks of Coal by Coal R
- Page 9 and 10: Table A5.B. Relative Standard Error
- Page 11 and 12: Table ES1.A. Total Electric Power I
- Page 13 and 14: Table ES2.A. Summary Statistics: Re
- Page 15 and 16: Table ES3. New U.S. Electric Genera
- Page 17 and 18: Table ES3. New U.S. Electric Genera
- Page 19 and 20: Table ES3. New U.S. Electric Genera
- Page 21 and 22: Table ES3. New U.S. Electric Genera
- Page 23 and 24: Table ES3. New U.S. Electric Genera
- Page 25 and 26: Table ES3. New U.S. Electric Genera
- Page 27 and 28: Table ES4. Retired U.S. Electric Ge
- Page 29: Chapter 1. Net Generation U.S. Ener
- Page 33 and 34: Table 1.3. Net Generation by Energy
- Page 35 and 36: Table 1.5. Net Generation by Energy
- Page 37 and 38: Table 1.6.B. Net Generation by Stat
- Page 39 and 40: Table 1.7.B. Net Generation from Co
- Page 41 and 42: Table 1.8.B. Net Generation from Pe
- Page 43 and 44: Table 1.9.B. Net Generation from Pe
- Page 45 and 46: Table 1.10.B. Net Generation from N
- Page 47 and 48: Table 1.11.B. Net Generation from O
- Page 49 and 50: Table 1.12.B. Net Generation from N
- Page 51 and 52: Table 1.13.B. Net Generation from H
- Page 53 and 54: Table 1.14.B. Net Generation from O
- Page 55 and 56: Table 1.15.B. Net Generation from H
- Page 57 and 58: Table 1.16.B. Net Generation from O
- Page 59 and 60: Table 1.17.B. Net Generation from W
- Page 61 and 62: Table 1.18.B. Net Generation from B
- Page 63 and 64: Table 1.20.A. Net Generation from S
- Page 65 and 66: Table 2.1.A. Coal: Consumption for
- Page 67 and 68: Table 2.1.C. Coal: Consumption for
- Page 69 and 70: Table 2.2.B. Petroleum Liquids: Con
- Page 71 and 72: Table 2.3.A. Petroleum Coke: Consum
- Page 73 and 74: Table 2.3.C. Petroleum Coke: Consum
- Page 75 and 76: Table 2.4.B. Natural Gas: Consumpti
- Page 77 and 78: Table 2.5.A. Consumption of Coal fo
- Page 79 and 80: Table 2.6.A. Consumption of Petrole
- Page 81 and 82:
Table 2.7.A. Consumption of Petrole
- Page 83 and 84:
Table 2.8.A. Consumption of Natural
- Page 85 and 86:
Chapter 3. Fossil-Fuel Stocks for E
- Page 87 and 88:
Table 3.2. Stocks of Coal, Petroleu
- Page 89 and 90:
Table 3.4. Stocks of Coal by Coal R
- Page 91 and 92:
Table 4.1. Receipts, Average Cost,
- Page 93 and 94:
Table 4.2. Receipts, Average Cost,
- Page 95 and 96:
Table 4.3. Receipts, Average Cost,
- Page 97 and 98:
Table 4.4. Receipts, Average Cost,
- Page 99 and 100:
Table 4.5. Receipts, Average Cost,
- Page 101 and 102:
Table 4.6.A. Receipts of Coal Deliv
- Page 103 and 104:
Table 4.7.A. Receipts of Petroleum
- Page 105 and 106:
Table 4.8.A. Receipts of Petroleum
- Page 107 and 108:
Table 4.9.A. Receipts of Natural Ga
- Page 109 and 110:
Table 4.10.A. Average Cost of Coal
- Page 111 and 112:
Table 4.11.A. Average Cost of Petro
- Page 113 and 114:
Table 4.12.A. Average Cost of Petro
- Page 115 and 116:
Table 4.13.A. Average Cost of Natur
- Page 117 and 118:
Table 4.14. Receipts and Quality of
- Page 119 and 120:
Table 4.16. Receipts and Quality of
- Page 121 and 122:
Table 4.18. Receipts and Quality of
- Page 123 and 124:
Table 5.1. Retail Sales of Electric
- Page 125 and 126:
Table 5.3. Average Retail Price of
- Page 127 and 128:
Table 5.4.B. Retail Sales of Electr
- Page 129 and 130:
Table 5.5.B. Revenue from Retail Sa
- Page 131 and 132:
Table 5.6.B. Average Retail Price o
- Page 133 and 134:
Appendix A Relative Standard Error
- Page 135 and 136:
Table A1.B. Relative Standard Error
- Page 137 and 138:
Table A2.A. Relative Standard Error
- Page 139 and 140:
Table A2.B. Relative Standard Error
- Page 141 and 142:
Table A3.A. Relative Standard Error
- Page 143 and 144:
Table A3.B. Relative Standard Error
- Page 145 and 146:
Table A4.A. Relative Standard Error
- Page 147 and 148:
Table A4.B. Relative Standard Error
- Page 149 and 150:
Table A5.A. Relative Standard Error
- Page 151 and 152:
Table A5.B. Relative Standard Error
- Page 153 and 154:
Table A6.A. Relative Standard Error
- Page 155 and 156:
Table A7.A. Relative Standard Error
- Page 157 and 158:
Table A8.A. Relative Standard Error
- Page 159 and 160:
Appendix B Major Disturbances and U
- Page 161 and 162:
05/25/11 Duke Energy Midwest(RFC) 1
- Page 163 and 164:
Table B.1. Major Disturbances and U
- Page 165 and 166:
Table B.2. Major Disturbances and U
- Page 167 and 168:
Table B.2. Major Disturbances and U
- Page 169 and 170:
The Energy Information Administrati
- Page 171 and 172:
Data Sources For Electric Power Mon
- Page 173 and 174:
ate charged by the electric utility
- Page 175 and 176:
data only on fossil-steam plants, b
- Page 177 and 178:
contents of the components of MSW w
- Page 179 and 180:
Construction 23 Manufacturing 311 F
- Page 181 and 182:
Table C2. Comparison of Preliminary
- Page 183 and 184:
Table C4. Unit-of-Measure Equivalen
- Page 185 and 186:
20 Knaub, J.R., Jr. (2003), “Appl
- Page 187 and 188:
such as briquettes, pellets, or ext
- Page 189 and 190:
order to provide, distribute, and s
- Page 191 and 192:
station(s) for station service or a
- Page 193:
concentrations of 1 percent or less