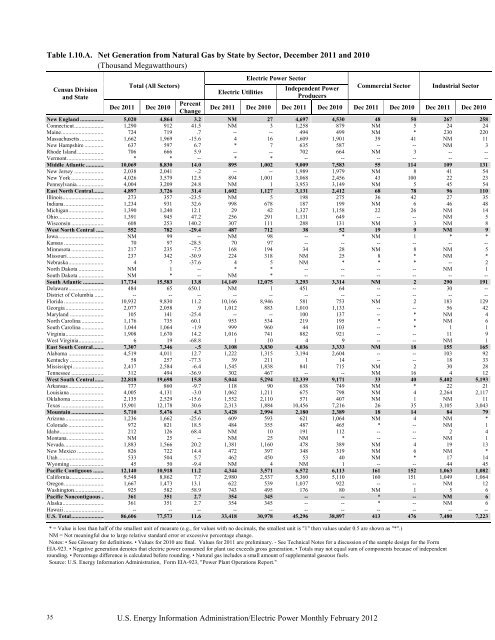
Table 1.10.A. Net Generation from Natural Gas by State by Sector, December 2011 and 2010 (Thousand Megawatthours) 35 Census Division and State Total (All Sectors) <strong>Electric</strong> Utilities <strong>Electric</strong> <strong>Power</strong> Sector Independent <strong>Power</strong> Producers U.S. Energy Information Administration/<strong>Electric</strong> <strong>Power</strong> <strong>Monthly</strong> <strong>February</strong> <strong>2012</strong> Commercial Sector Industrial Sector Dec 2011 Dec 2010 Percent Change Dec 2011 Dec 2010 Dec 2011 Dec 2010 Dec 2011 Dec 2010 Dec 2011 Dec 2010 New England ................. 5,020 4,864 3.2 NM 27 4,697 4,530 48 50 267 258 Connecticut ..................... 1,290 912 41.5 NM 3 1,258 879 NM 5 24 24 Maine .............................. 724 719 .7 -- -- 494 499 NM * 230 220 Massachusetts ................. 1,662 1,969 -15.6 4 16 1,609 1,901 39 41 NM 11 New Hampshire .............. 637 597 6.7 * 7 635 587 -- -- NM 3 Rhode Island ................... 706 666 5.9 -- -- 702 664 NM 3 -- -- Vermont .......................... * * -- * * -- -- -- -- -- -- Middle Atlantic ............. 10,069 8,830 14.0 895 1,002 9,009 7,583 55 114 109 131 New Jersey ..................... 2,038 2,041 -.2 -- -- 1,989 1,979 NM 8 41 54 New York ....................... 4,026 3,579 12.5 894 1,001 3,068 2,456 43 100 22 23 Pennsylvania ................... 4,004 3,209 24.8 NM 1 3,953 3,149 NM 5 45 54 East North Central........ 4,897 3,726 31.4 1,602 1,127 3,131 2,412 68 78 96 110 Illinois............................. 273 357 -23.5 NM 5 198 275 36 42 27 35 Indiana ............................ 1,234 931 32.6 998 678 187 199 NM 6 46 48 Michigan ......................... 1,390 1,240 12.1 29 42 1,327 1,158 22 26 NM 14 Ohio ................................ 1,391 945 47.2 256 291 1,131 649 -- -- NM 5 Wisconsin ....................... 608 253 140.2 307 111 288 131 NM 3 NM 8 West North Central ...... 552 782 -29.4 487 712 38 52 19 9 NM 9 Iowa ................................ NM 99 -- NM 98 -- * NM 1 * * Kansas ............................ 70 97 -28.5 70 97 -- -- -- -- -- -- Minnesota ....................... 217 235 -7.5 168 194 34 28 NM 8 NM 5 Missouri .......................... 237 342 -30.9 224 318 NM 25 8 * NM * Nebraska ......................... 4 7 -37.6 4 5 NM * * * -- 2 North Dakota .................. NM 1 -- * * -- -- -- -- NM 1 South Dakota .................. NM * -- NM * -- -- -- -- -- -- South Atlantic ............... 17,734 15,583 13.8 14,149 12,075 3,293 3,314 NM 2 290 191 Delaware ......................... 484 65 650.1 NM 1 451 64 -- -- 30 -- District of Columbia ....... -- -- -- -- -- -- -- -- -- -- -- Florida ............................ 10,932 9,830 11.2 10,166 8,946 581 753 NM 2 183 129 Georgia ........................... 2,077 2,058 .9 1,012 883 1,010 1,133 -- -- 56 42 Maryland ........................ 105 141 -25.4 -- -- 100 137 -- * NM 4 North Carolina ................ 1,176 735 60.1 953 534 219 195 * * NM 6 South Carolina ................ 1,044 1,064 -1.9 999 960 44 103 -- * 1 1 Virginia ........................... 1,908 1,670 14.2 1,016 741 882 921 -- -- 11 9 West Virginia .................. 6 19 -68.8 1 10 4 9 -- -- NM 1 East South Central ........ 7,307 7,346 -.5 3,108 3,830 4,036 3,333 NM 18 155 165 Alabama ......................... 4,519 4,011 12.7 1,222 1,315 3,194 2,604 -- -- 103 92 Kentucky ........................ 58 257 -77.3 39 211 1 14 -- -- 18 33 Mississippi ...................... 2,417 2,584 -6.4 1,545 1,838 841 715 NM 2 30 28 Tennessee ....................... 312 494 -36.9 302 467 -- -- NM 16 4 12 West South Central ....... 22,818 19,698 15.8 5,044 5,294 12,339 9,171 33 40 5,402 5,193 Arkansas ......................... 777 860 -9.7 118 90 638 749 NM * 22 21 Louisiana ........................ 4,005 4,131 -3.0 1,062 1,211 675 798 NM 4 2,264 2,117 Oklahoma ....................... 2,135 2,529 -15.6 1,552 2,110 571 407 NM 1 NM 11 Texas .............................. 15,901 12,178 30.6 2,313 1,884 10,456 7,216 26 35 3,105 3,043 Mountain ....................... 5,710 5,476 4.3 3,428 2,994 2,180 2,389 18 14 84 79 Arizona ........................... 1,236 1,662 -25.6 609 593 621 1,064 NM 4 NM * Colorado ......................... 972 821 18.5 484 355 487 465 * -- NM 1 Idaho ............................... 212 126 68.4 NM 10 191 112 -- -- 2 4 Montana .......................... NM 25 -- NM 25 NM * -- -- NM 1 Nevada ............................ 1,883 1,566 20.2 1,381 1,160 478 389 NM 4 19 13 New Mexico ................... 826 722 14.4 472 397 348 319 NM 6 NM * Utah ................................ 533 504 5.7 462 450 53 40 NM * 17 14 Wyoming ........................ 45 50 -9.4 NM 4 NM 1 -- -- 44 45 Pacific Contiguous ........ 12,140 10,918 11.2 4,344 3,571 6,572 6,113 161 152 1,063 1,082 California ........................ 9,548 8,862 7.7 2,980 2,537 5,360 5,110 160 151 1,049 1,064 Oregon ............................ 1,667 1,473 13.1 622 539 1,037 922 -- -- NM 12 Washington ..................... 925 582 58.9 743 495 176 80 NM 1 5 6 Pacific Noncontiguous .. 361 351 2.7 354 345 -- -- * -- NM 6 Alaska ............................. 361 351 2.7 354 345 -- -- * -- NM 6 Hawaii ............................ -- -- -- -- -- -- -- -- -- -- -- U.S. Total ....................... 86,606 77,573 11.6 33,418 30,978 45,296 38,897 413 476 7,480 7,223 * = Value is less than half of the smallest unit of measure (e.g., for values with no decimals, the smallest unit is "1" then values under 0.5 are shown as "*".) NM = Not meaningful due to large relative standard error or excessive percentage change. Notes: • See Glossary for definitions. • Values for 2010 are final. Values for 2011 are preliminary. - See Technical Notes for a discussion of the sample design for the Form <strong>EIA</strong>-923. • Negative generation denotes that electric power consumed for plant use exceeds gross generation. • Totals may not equal sum of components because of independent rounding. • Percentage difference is calculated before rounding. • Natural gas includes a small amount of supplemental gaseous fuels. Source: U.S. Energy Information Administration, Form <strong>EIA</strong>-923, "<strong>Power</strong> Plant Operations Report."
Table 1.10.B. Net Generation from Natural Gas by State by Sector, Year-to-Date through December 2011 and 2010 (Thousand Megawatthours) Census Division and State Total (All Sectors) <strong>Electric</strong> Utilities <strong>Electric</strong> <strong>Power</strong> Sector Independent <strong>Power</strong> Producers U.S. Energy Information Administration/<strong>Electric</strong> <strong>Power</strong> <strong>Monthly</strong> <strong>February</strong> <strong>2012</strong> Commercial Sector Industrial Sector 2011 2010 Percent Change 2011 2010 2011 2010 2011 2010 2011 2010 New England ................. 63,738 58,623 8.7 361 716 59,873 54,399 567 543 2,938 2,966 Connecticut ..................... 15,160 11,716 29.4 NM 31 14,771 11,324 66 70 289 291 Maine .............................. 7,319 8,374 -12.6 -- -- 4,851 5,861 NM * 2,468 2,512 Massachusetts ................. 25,987 25,582 1.6 243 506 25,141 24,500 447 441 156 134 New Hampshire .............. 6,657 5,365 24.1 80 175 6,552 5,162 -- -- NM 28 Rhode Island ................... 8,612 7,583 13.6 -- -- 8,559 7,552 53 31 -- -- Vermont .......................... 3 4 -13.4 3 4 -- -- -- -- -- -- Middle Atlantic ............. 117,931 107,535 9.7 12,822 13,411 103,256 92,058 583 700 1,270 1,367 New Jersey ..................... 25,095 24,902 .8 -- -- 24,518 24,261 97 102 480 539 New York ....................... 50,465 48,916 3.2 12,807 13,396 36,983 34,710 428 544 247 266 Pennsylvania ................... 42,371 33,718 25.7 NM 14 41,755 33,087 58 54 542 562 East North Central........ 47,310 37,073 27.6 14,574 10,236 30,989 24,996 610 596 1,138 1,246 Illinois............................. 5,949 5,724 3.9 485 487 4,708 4,407 403 385 352 445 Indiana ............................ 9,897 6,475 52.8 7,216 3,782 2,122 2,128 40 41 518 524 Michigan ......................... 12,996 12,249 6.1 1,055 1,173 11,716 10,839 101 97 125 140 Ohio ................................ 12,104 7,128 69.8 2,839 1,587 9,219 5,496 -- -- 46 45 Wisconsin ....................... 6,365 5,497 15.8 2,979 3,205 3,224 2,126 65 73 96 92 West North Central ...... 12,377 13,156 -5.9 10,622 11,045 1,511 1,893 154 124 90 95 Iowa ................................ 1,126 1,312 -14.2 1,102 1,297 NM * NM 10 NM 6 Kansas ............................ 2,759 2,287 20.6 2,759 2,287 -- -- -- -- -- -- Minnesota ....................... 3,182 4,341 -26.7 2,387 3,235 650 943 86 104 59 60 Missouri .......................... 4,657 4,690 -.7 3,736 3,729 861 950 58 10 NM 1 Nebraska ......................... 473 375 26.2 473 362 NM * NM * -- 12 North Dakota .................. NM 16 -- NM * -- -- -- -- NM 16 South Dakota .................. 162 135 20.6 162 135 -- -- -- -- -- -- South Atlantic ............... 214,652 194,794 10.2 170,169 153,414 41,802 39,131 36 30 2,645 2,219 Delaware ......................... 4,834 2,865 68.7 NM 29 4,591 2,836 -- -- 210 -- District of Columbia ....... -- -- -- -- -- -- -- -- -- -- -- Florida ............................ 138,547 128,634 7.7 127,045 116,880 9,773 10,205 33 28 1,695 1,520 Georgia ........................... 26,522 23,884 11.0 12,923 11,282 13,088 12,112 -- -- 510 491 Maryland ........................ 2,237 2,897 -22.8 -- -- 2,179 2,839 NM * 57 58 North Carolina ................ 11,144 8,447 31.9 8,516 6,277 2,556 2,122 1 1 71 47 South Carolina ................ 12,762 10,927 16.8 11,561 9,323 1,188 1,593 NM * 12 11 Virginia ........................... 18,353 16,999 8.0 10,061 9,574 8,211 7,341 -- -- 81 84 West Virginia .................. 254 140 82.2 31 48 215 83 -- -- NM 8 East South Central ........ 82,800 72,997 13.4 39,870 37,975 41,249 33,398 94 96 1,587 1,528 Alabama ......................... 48,068 39,235 22.5 14,050 13,520 33,033 24,778 -- -- 985 937 Kentucky ........................ 1,496 1,841 -18.7 1,167 1,455 121 163 -- -- 209 223 Mississippi ...................... 30,007 29,619 1.3 21,570 20,812 8,096 8,457 23 22 319 328 Tennessee ....................... 3,229 2,302 40.2 3,083 2,189 -- -- 72 74 74 39 West South Central ....... 302,604 284,637 6.3 82,321 76,558 160,520 149,140 480 530 59,283 58,409 Arkansas ......................... 12,935 12,469 3.7 2,347 2,020 10,378 10,223 NM 1 209 224 Louisiana ........................ 54,209 51,344 5.6 22,085 18,924 7,943 8,715 47 47 24,135 23,657 Oklahoma ....................... 33,036 33,942 -2.7 24,179 24,945 8,717 8,862 29 25 111 109 Texas .............................. 202,425 186,882 8.3 33,711 30,668 133,482 121,339 403 457 34,828 34,418 Mountain ....................... 71,144 81,599 -12.8 40,380 40,447 29,758 40,131 195 208 811 813 Arizona ........................... 23,403 29,676 -21.1 9,990 9,753 13,344 19,849 65 68 NM 5 Colorado ......................... 10,301 11,062 -6.9 5,116 3,803 5,168 7,242 4 4 NM 13 Idaho ............................... 1,151 1,689 -31.9 207 170 902 1,489 -- -- 41 30 Montana .......................... NM 57 -- NM 33 NM 20 -- -- NM 4 Nevada ............................ 21,785 23,688 -8.0 15,395 16,001 6,141 7,426 59 62 191 199 New Mexico ................... 8,695 8,512 2.2 4,985 4,964 3,637 3,475 67 73 NM * Utah ................................ 5,312 6,455 -17.7 4,615 5,671 528 629 NM * 169 155 Wyoming ........................ 446 459 -2.9 NM 51 NM 3 -- -- 387 405 Pacific Contiguous ........ 100,339 133,533 -24.9 33,217 45,130 53,627 73,628 1,807 1,898 11,689 12,876 California ........................ 86,856 107,522 -19.2 26,587 31,252 46,919 61,671 1,793 1,883 11,556 12,716 Oregon ............................ 8,453 15,651 -46.0 2,841 6,121 5,535 9,411 -- -- 78 119 Washington ..................... 5,030 10,359 -51.4 3,789 7,757 1,173 2,546 NM 15 55 41 Pacific Noncontiguous .. 3,698 3,750 -1.4 3,647 3,685 -- -- NM 1 50 65 Alaska ............................. 3,698 3,750 -1.4 3,647 3,685 -- -- NM 1 50 65 Hawaii ............................ -- -- -- -- -- -- -- -- -- -- -- U.S. Total ....................... 1,016,595 987,697 2.9 407,983 392,616 522,585 508,774 4,526 4,725 81,500 81,583 * = Value is less than half of the smallest unit of measure (e.g., for values with no decimals, the smallest unit is "1" then values under 0.5 are shown as "*".) NM = Not meaningful due to large relative standard error or excessive percentage change. Notes: • See Glossary for definitions. • Values for 2010 are final. Values for 2011 are preliminary. - See Technical Notes for a discussion of the sample design for the Form <strong>EIA</strong>-923. • Negative generation denotes that electric power consumed for plant use exceeds gross generation. • Totals may not equal sum of components because of independent rounding. • Percentage difference is calculated before rounding. • Natural gas includes a small amount of supplemental gaseous fuels. Source: U.S. Energy Information Administration, Form <strong>EIA</strong>-923, "<strong>Power</strong> Plant Operations Report." 36
- Page 1 and 2: Electric Power Monthly February 201
- Page 3 and 4: The Electric Power Monthly (EPM) pr
- Page 5 and 6: Table Index Executive Summary .....
- Page 7 and 8: Table 3.4. Stocks of Coal by Coal R
- Page 9 and 10: Table A5.B. Relative Standard Error
- Page 11 and 12: Table ES1.A. Total Electric Power I
- Page 13 and 14: Table ES2.A. Summary Statistics: Re
- Page 15 and 16: Table ES3. New U.S. Electric Genera
- Page 17 and 18: Table ES3. New U.S. Electric Genera
- Page 19 and 20: Table ES3. New U.S. Electric Genera
- Page 21 and 22: Table ES3. New U.S. Electric Genera
- Page 23 and 24: Table ES3. New U.S. Electric Genera
- Page 25 and 26: Table ES3. New U.S. Electric Genera
- Page 27 and 28: Table ES4. Retired U.S. Electric Ge
- Page 29 and 30: Chapter 1. Net Generation U.S. Ener
- Page 31 and 32: Table 1.1.A. Net Generation by Othe
- Page 33 and 34: Table 1.3. Net Generation by Energy
- Page 35 and 36: Table 1.5. Net Generation by Energy
- Page 37 and 38: Table 1.6.B. Net Generation by Stat
- Page 39 and 40: Table 1.7.B. Net Generation from Co
- Page 41 and 42: Table 1.8.B. Net Generation from Pe
- Page 43: Table 1.9.B. Net Generation from Pe
- Page 47 and 48: Table 1.11.B. Net Generation from O
- Page 49 and 50: Table 1.12.B. Net Generation from N
- Page 51 and 52: Table 1.13.B. Net Generation from H
- Page 53 and 54: Table 1.14.B. Net Generation from O
- Page 55 and 56: Table 1.15.B. Net Generation from H
- Page 57 and 58: Table 1.16.B. Net Generation from O
- Page 59 and 60: Table 1.17.B. Net Generation from W
- Page 61 and 62: Table 1.18.B. Net Generation from B
- Page 63 and 64: Table 1.20.A. Net Generation from S
- Page 65 and 66: Table 2.1.A. Coal: Consumption for
- Page 67 and 68: Table 2.1.C. Coal: Consumption for
- Page 69 and 70: Table 2.2.B. Petroleum Liquids: Con
- Page 71 and 72: Table 2.3.A. Petroleum Coke: Consum
- Page 73 and 74: Table 2.3.C. Petroleum Coke: Consum
- Page 75 and 76: Table 2.4.B. Natural Gas: Consumpti
- Page 77 and 78: Table 2.5.A. Consumption of Coal fo
- Page 79 and 80: Table 2.6.A. Consumption of Petrole
- Page 81 and 82: Table 2.7.A. Consumption of Petrole
- Page 83 and 84: Table 2.8.A. Consumption of Natural
- Page 85 and 86: Chapter 3. Fossil-Fuel Stocks for E
- Page 87 and 88: Table 3.2. Stocks of Coal, Petroleu
- Page 89 and 90: Table 3.4. Stocks of Coal by Coal R
- Page 91 and 92: Table 4.1. Receipts, Average Cost,
- Page 93 and 94: Table 4.2. Receipts, Average Cost,
- Page 95 and 96:
Table 4.3. Receipts, Average Cost,
- Page 97 and 98:
Table 4.4. Receipts, Average Cost,
- Page 99 and 100:
Table 4.5. Receipts, Average Cost,
- Page 101 and 102:
Table 4.6.A. Receipts of Coal Deliv
- Page 103 and 104:
Table 4.7.A. Receipts of Petroleum
- Page 105 and 106:
Table 4.8.A. Receipts of Petroleum
- Page 107 and 108:
Table 4.9.A. Receipts of Natural Ga
- Page 109 and 110:
Table 4.10.A. Average Cost of Coal
- Page 111 and 112:
Table 4.11.A. Average Cost of Petro
- Page 113 and 114:
Table 4.12.A. Average Cost of Petro
- Page 115 and 116:
Table 4.13.A. Average Cost of Natur
- Page 117 and 118:
Table 4.14. Receipts and Quality of
- Page 119 and 120:
Table 4.16. Receipts and Quality of
- Page 121 and 122:
Table 4.18. Receipts and Quality of
- Page 123 and 124:
Table 5.1. Retail Sales of Electric
- Page 125 and 126:
Table 5.3. Average Retail Price of
- Page 127 and 128:
Table 5.4.B. Retail Sales of Electr
- Page 129 and 130:
Table 5.5.B. Revenue from Retail Sa
- Page 131 and 132:
Table 5.6.B. Average Retail Price o
- Page 133 and 134:
Appendix A Relative Standard Error
- Page 135 and 136:
Table A1.B. Relative Standard Error
- Page 137 and 138:
Table A2.A. Relative Standard Error
- Page 139 and 140:
Table A2.B. Relative Standard Error
- Page 141 and 142:
Table A3.A. Relative Standard Error
- Page 143 and 144:
Table A3.B. Relative Standard Error
- Page 145 and 146:
Table A4.A. Relative Standard Error
- Page 147 and 148:
Table A4.B. Relative Standard Error
- Page 149 and 150:
Table A5.A. Relative Standard Error
- Page 151 and 152:
Table A5.B. Relative Standard Error
- Page 153 and 154:
Table A6.A. Relative Standard Error
- Page 155 and 156:
Table A7.A. Relative Standard Error
- Page 157 and 158:
Table A8.A. Relative Standard Error
- Page 159 and 160:
Appendix B Major Disturbances and U
- Page 161 and 162:
05/25/11 Duke Energy Midwest(RFC) 1
- Page 163 and 164:
Table B.1. Major Disturbances and U
- Page 165 and 166:
Table B.2. Major Disturbances and U
- Page 167 and 168:
Table B.2. Major Disturbances and U
- Page 169 and 170:
The Energy Information Administrati
- Page 171 and 172:
Data Sources For Electric Power Mon
- Page 173 and 174:
ate charged by the electric utility
- Page 175 and 176:
data only on fossil-steam plants, b
- Page 177 and 178:
contents of the components of MSW w
- Page 179 and 180:
Construction 23 Manufacturing 311 F
- Page 181 and 182:
Table C2. Comparison of Preliminary
- Page 183 and 184:
Table C4. Unit-of-Measure Equivalen
- Page 185 and 186:
20 Knaub, J.R., Jr. (2003), “Appl
- Page 187 and 188:
such as briquettes, pellets, or ext
- Page 189 and 190:
order to provide, distribute, and s
- Page 191 and 192:
station(s) for station service or a
- Page 193:
concentrations of 1 percent or less