

Electric Power Monthly February 2012 - EIA
Electric Power Monthly February 2012 - EIA
Electric Power Monthly February 2012 - EIA

You also want an ePaper? Increase the reach of your titles
YUMPU automatically turns print PDFs into web optimized ePapers that Google loves.
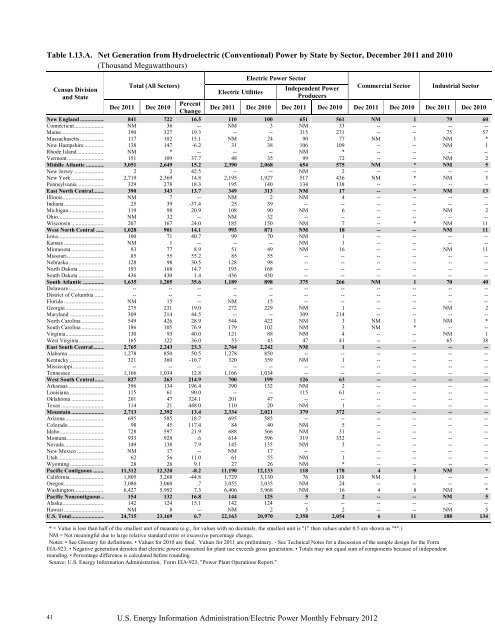
Table 1.13.A. Net Generation from Hydroelectric (Conventional) <strong>Power</strong> by State by Sector, December 2011 and 2010<br />
(Thousand Megawatthours)<br />
41<br />
Census Division<br />
and State<br />
Total (All Sectors)<br />
<strong>Electric</strong> Utilities<br />
<strong>Electric</strong> <strong>Power</strong> Sector<br />
Independent <strong>Power</strong><br />
Producers<br />
U.S. Energy Information Administration/<strong>Electric</strong> <strong>Power</strong> <strong>Monthly</strong> <strong>February</strong> <strong>2012</strong><br />
Commercial Sector Industrial Sector<br />
Dec 2011 Dec 2010 Percent<br />
Change<br />
Dec 2011 Dec 2010 Dec 2011 Dec 2010 Dec 2011 Dec 2010 Dec 2011 Dec 2010<br />
New England ................. 841 722 16.5 110 100 651 561 NM 1 79 60<br />
Connecticut ..................... NM 36 -- NM 3 NM 33 -- -- -- --<br />
Maine .............................. 390 327 19.3 -- -- 315 271 -- -- 75 57<br />
Massachusetts ................. 117 102 15.1 NM 24 90 77 NM 1 NM *<br />
New Hampshire .............. 138 147 -6.2 31 38 106 109 -- -- NM 1<br />
Rhode Island ................... NM * -- -- -- NM * -- -- -- --<br />
Vermont .......................... 151 109 37.7 48 35 99 72 -- -- NM 2<br />
Middle Atlantic ............. 3,051 2,649 15.2 2,390 2,068 654 575 NM * NM 5<br />
New Jersey ..................... 2 2 42.5 -- -- NM 2 -- -- -- --<br />
New York ....................... 2,719 2,369 14.8 2,195 1,927 517 436 NM * NM 5<br />
Pennsylvania ................... 329 278 18.3 195 140 134 138 -- -- -- --<br />
East North Central........ 390 343 13.7 349 313 NM 17 -- * NM 13<br />
Illinois............................. NM 7 -- NM 2 NM 4 -- -- -- --<br />
Indiana ............................ 25 39 -37.4 25 39 -- -- -- -- -- --<br />
Michigan ......................... 119 98 20.9 108 90 NM 6 -- -- NM 2<br />
Ohio ................................ NM 32 -- NM 32 -- -- -- -- -- --<br />
Wisconsin ....................... 207 167 24.0 185 150 NM 7 -- * NM 11<br />
West North Central ...... 1,028 901 14.1 993 871 NM 18 -- -- NM 11<br />
Iowa ................................ 100 71 40.7 99 70 NM 1 -- -- -- --<br />
Kansas ............................ NM 1 -- -- -- NM 1 -- -- -- --<br />
Minnesota ....................... 83 77 8.9 51 49 NM 16 -- -- NM 11<br />
Missouri .......................... 85 55 55.2 85 55 -- -- -- -- -- --<br />
Nebraska ......................... 128 98 30.5 128 98 -- -- -- -- -- --<br />
North Dakota .................. 193 168 14.7 193 168 -- -- -- -- -- --<br />
South Dakota .................. 436 430 1.4 436 430 -- -- -- -- -- --<br />
South Atlantic ............... 1,635 1,205 35.6 1,189 898 375 266 NM 1 70 40<br />
Delaware ......................... -- -- -- -- -- -- -- -- -- -- --<br />
District of Columbia ....... -- -- -- -- -- -- -- -- -- -- --<br />
Florida ............................ NM 15 -- NM 15 -- -- -- -- -- --<br />
Georgia ........................... 275 231 19.0 272 229 NM 1 -- -- NM 2<br />
Maryland ........................ 309 214 44.5 -- -- 309 214 -- -- -- --<br />
North Carolina ................ 549 426 28.9 544 422 NM 3 NM 1 NM *<br />
South Carolina ................ 186 105 76.9 179 102 NM 3 NM * -- --<br />
Virginia ........................... 130 93 40.0 121 88 NM 4 -- -- NM 1<br />
West Virginia .................. 165 122 36.0 53 43 47 41 -- -- 65 38<br />
East South Central ........ 2,765 2,243 23.3 2,764 2,242 NM 1 -- -- -- --<br />
Alabama ......................... 1,278 850 50.5 1,278 850 -- -- -- -- -- --<br />
Kentucky ........................ 321 360 -10.7 320 359 NM 1 -- -- -- --<br />
Mississippi ...................... -- -- -- -- -- -- -- -- -- -- --<br />
Tennessee ....................... 1,166 1,034 12.8 1,166 1,034 -- -- -- -- -- --<br />
West South Central ....... 827 263 214.9 700 199 126 63 -- -- -- --<br />
Arkansas ......................... 396 134 196.4 390 132 NM 2 -- -- -- --<br />
Louisiana ........................ 115 61 90.0 -- -- 115 61 -- -- -- --<br />
Oklahoma ....................... 201 47 324.1 201 47 -- -- -- -- -- --<br />
Texas .............................. 114 21 448.0 110 20 NM 1 -- -- -- --<br />
Mountain ....................... 2,713 2,392 13.4 2,334 2,021 379 372 -- -- -- --<br />
Arizona ........................... 695 585 18.7 695 585 -- -- -- -- -- --<br />
Colorado ......................... 98 45 117.4 84 40 NM 5 -- -- -- --<br />
Idaho ............................... 728 597 21.9 688 566 NM 31 -- -- -- --<br />
Montana .......................... 933 928 .6 614 596 319 332 -- -- -- --<br />
Nevada ............................ 149 138 7.9 145 135 NM 3 -- -- -- --<br />
New Mexico ................... NM 17 -- NM 17 -- -- -- -- -- --<br />
Utah ................................ 62 56 11.0 61 55 NM 1 -- -- -- --<br />
Wyoming ........................ 28 26 9.1 27 26 NM * -- -- -- --<br />
Pacific Contiguous ........ 11,312 12,320 -8.2 11,190 12,133 118 178 4 9 NM *<br />
California ........................ 1,805 3,268 -44.8 1,729 3,130 76 138 NM 1 -- --<br />
Oregon ............................ 3,080 3,060 .7 3,055 3,035 NM 24 -- -- -- --<br />
Washington ..................... 6,427 5,992 7.3 6,406 5,968 NM 16 4 8 NM *<br />
Pacific Noncontiguous .. 154 132 16.8 144 125 5 2 -- -- NM 5<br />
Alaska ............................. 142 124 15.1 142 124 -- -- -- -- -- --<br />
Hawaii ............................ NM 8 -- NM 2 5 2 -- -- NM 5<br />
U.S. Total ....................... 24,715 23,169 6.7 22,163 20,970 2,358 2,054 6 11 188 134<br />
* = Value is less than half of the smallest unit of measure (e.g., for values with no decimals, the smallest unit is "1" then values under 0.5 are shown as "*".)<br />
NM = Not meaningful due to large relative standard error or excessive percentage change.<br />
Notes: • See Glossary for definitions. • Values for 2010 are final. Values for 2011 are preliminary. - See Technical Notes for a discussion of the sample design for the Form<br />
<strong>EIA</strong>-923. • Negative generation denotes that electric power consumed for plant use exceeds gross generation. • Totals may not equal sum of components because of independent<br />
rounding. • Percentage difference is calculated before rounding.<br />
Source: U.S. Energy Information Administration, Form <strong>EIA</strong>-923, "<strong>Power</strong> Plant Operations Report."


