

Electric Power Monthly February 2012 - EIA
Electric Power Monthly February 2012 - EIA
Electric Power Monthly February 2012 - EIA

Create successful ePaper yourself
Turn your PDF publications into a flip-book with our unique Google optimized e-Paper software.
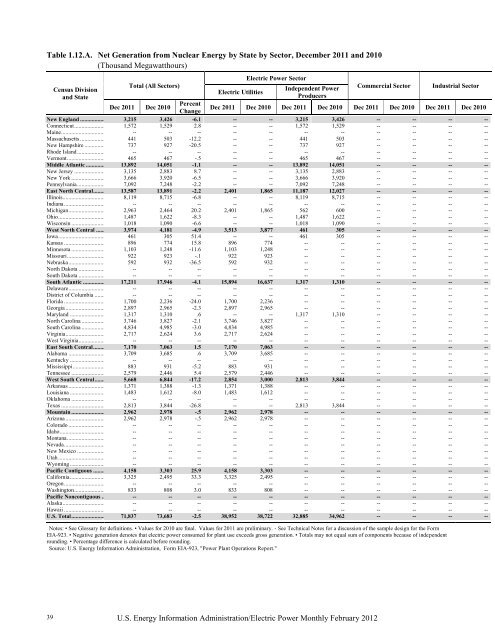
Table 1.12.A. Net Generation from Nuclear Energy by State by Sector, December 2011 and 2010<br />
(Thousand Megawatthours)<br />
39<br />
Census Division<br />
and State<br />
Total (All Sectors)<br />
<strong>Electric</strong> Utilities<br />
<strong>Electric</strong> <strong>Power</strong> Sector<br />
Independent <strong>Power</strong><br />
Producers<br />
U.S. Energy Information Administration/<strong>Electric</strong> <strong>Power</strong> <strong>Monthly</strong> <strong>February</strong> <strong>2012</strong><br />
Commercial Sector Industrial Sector<br />
Dec 2011 Dec 2010 Percent<br />
Change<br />
Dec 2011 Dec 2010 Dec 2011 Dec 2010 Dec 2011 Dec 2010 Dec 2011 Dec 2010<br />
New England ................. 3,215 3,426 -6.1 -- -- 3,215 3,426 -- -- -- --<br />
Connecticut ..................... 1,572 1,529 2.8 -- -- 1,572 1,529 -- -- -- --<br />
Maine .............................. -- -- -- -- -- -- -- -- -- -- --<br />
Massachusetts ................. 441 503 -12.2 -- -- 441 503 -- -- -- --<br />
New Hampshire .............. 737 927 -20.5 -- -- 737 927 -- -- -- --<br />
Rhode Island ................... -- -- -- -- -- -- -- -- -- -- --<br />
Vermont .......................... 465 467 -.5 -- -- 465 467 -- -- -- --<br />
Middle Atlantic ............. 13,892 14,051 -1.1 -- -- 13,892 14,051 -- -- -- --<br />
New Jersey ..................... 3,135 2,883 8.7 -- -- 3,135 2,883 -- -- -- --<br />
New York ....................... 3,666 3,920 -6.5 -- -- 3,666 3,920 -- -- -- --<br />
Pennsylvania ................... 7,092 7,248 -2.2 -- -- 7,092 7,248 -- -- -- --<br />
East North Central........ 13,587 13,891 -2.2 2,401 1,865 11,187 12,027 -- -- -- --<br />
Illinois............................. 8,119 8,715 -6.8 -- -- 8,119 8,715 -- -- -- --<br />
Indiana ............................ -- -- -- -- -- -- -- -- -- -- --<br />
Michigan ......................... 2,963 2,464 20.2 2,401 1,865 562 600 -- -- -- --<br />
Ohio ................................ 1,487 1,622 -8.3 -- -- 1,487 1,622 -- -- -- --<br />
Wisconsin ....................... 1,018 1,090 -6.6 -- -- 1,018 1,090 -- -- -- --<br />
West North Central ...... 3,974 4,181 -4.9 3,513 3,877 461 305 -- -- -- --<br />
Iowa ................................ 461 305 51.4 -- -- 461 305 -- -- -- --<br />
Kansas ............................ 896 774 15.8 896 774 -- -- -- -- -- --<br />
Minnesota ....................... 1,103 1,248 -11.6 1,103 1,248 -- -- -- -- -- --<br />
Missouri .......................... 922 923 -.1 922 923 -- -- -- -- -- --<br />
Nebraska ......................... 592 932 -36.5 592 932 -- -- -- -- -- --<br />
North Dakota .................. -- -- -- -- -- -- -- -- -- -- --<br />
South Dakota .................. -- -- -- -- -- -- -- -- -- -- --<br />
South Atlantic ............... 17,211 17,946 -4.1 15,894 16,637 1,317 1,310 -- -- -- --<br />
Delaware ......................... -- -- -- -- -- -- -- -- -- -- --<br />
District of Columbia ....... -- -- -- -- -- -- -- -- -- -- --<br />
Florida ............................ 1,700 2,236 -24.0 1,700 2,236 -- -- -- -- -- --<br />
Georgia ........................... 2,897 2,965 -2.3 2,897 2,965 -- -- -- -- -- --<br />
Maryland ........................ 1,317 1,310 .6 -- -- 1,317 1,310 -- -- -- --<br />
North Carolina ................ 3,746 3,827 -2.1 3,746 3,827 -- -- -- -- -- --<br />
South Carolina ................ 4,834 4,985 -3.0 4,834 4,985 -- -- -- -- -- --<br />
Virginia ........................... 2,717 2,624 3.6 2,717 2,624 -- -- -- -- -- --<br />
West Virginia .................. -- -- -- -- -- -- -- -- -- -- --<br />
East South Central ........ 7,170 7,063 1.5 7,170 7,063 -- -- -- -- -- --<br />
Alabama ......................... 3,709 3,685 .6 3,709 3,685 -- -- -- -- -- --<br />
Kentucky ........................ -- -- -- -- -- -- -- -- -- -- --<br />
Mississippi ...................... 883 931 -5.2 883 931 -- -- -- -- -- --<br />
Tennessee ....................... 2,579 2,446 5.4 2,579 2,446 -- -- -- -- -- --<br />
West South Central ....... 5,668 6,844 -17.2 2,854 3,000 2,813 3,844 -- -- -- --<br />
Arkansas ......................... 1,371 1,388 -1.3 1,371 1,388 -- -- -- -- -- --<br />
Louisiana ........................ 1,483 1,612 -8.0 1,483 1,612 -- -- -- -- -- --<br />
Oklahoma ....................... -- -- -- -- -- -- -- -- -- -- --<br />
Texas .............................. 2,813 3,844 -26.8 -- -- 2,813 3,844 -- -- -- --<br />
Mountain ....................... 2,962 2,978 -.5 2,962 2,978 -- -- -- -- -- --<br />
Arizona ........................... 2,962 2,978 -.5 2,962 2,978 -- -- -- -- -- --<br />
Colorado ......................... -- -- -- -- -- -- -- -- -- -- --<br />
Idaho ............................... -- -- -- -- -- -- -- -- -- -- --<br />
Montana .......................... -- -- -- -- -- -- -- -- -- -- --<br />
Nevada ............................ -- -- -- -- -- -- -- -- -- -- --<br />
New Mexico ................... -- -- -- -- -- -- -- -- -- -- --<br />
Utah ................................ -- -- -- -- -- -- -- -- -- -- --<br />
Wyoming ........................ -- -- -- -- -- -- -- -- -- -- --<br />
Pacific Contiguous ........ 4,158 3,303 25.9 4,158 3,303 -- -- -- -- -- --<br />
California ........................ 3,325 2,495 33.3 3,325 2,495 -- -- -- -- -- --<br />
Oregon ............................ -- -- -- -- -- -- -- -- -- -- --<br />
Washington ..................... 833 808 3.0 833 808 -- -- -- -- -- --<br />
Pacific Noncontiguous .. -- -- -- -- -- -- -- -- -- -- --<br />
Alaska ............................. -- -- -- -- -- -- -- -- -- -- --<br />
Hawaii ............................ -- -- -- -- -- -- -- -- -- -- --<br />
U.S. Total ....................... 71,837 73,683 -2.5 38,952 38,722 32,885 34,962 -- -- -- --<br />
Notes: • See Glossary for definitions. • Values for 2010 are final. Values for 2011 are preliminary. - See Technical Notes for a discussion of the sample design for the Form<br />
<strong>EIA</strong>-923. • Negative generation denotes that electric power consumed for plant use exceeds gross generation. • Totals may not equal sum of components because of independent<br />
rounding. • Percentage difference is calculated before rounding.<br />
Source: U.S. Energy Information Administration, Form <strong>EIA</strong>-923, "<strong>Power</strong> Plant Operations Report."


