

Electric Power Monthly February 2012 - EIA
Electric Power Monthly February 2012 - EIA
Electric Power Monthly February 2012 - EIA

Create successful ePaper yourself
Turn your PDF publications into a flip-book with our unique Google optimized e-Paper software.
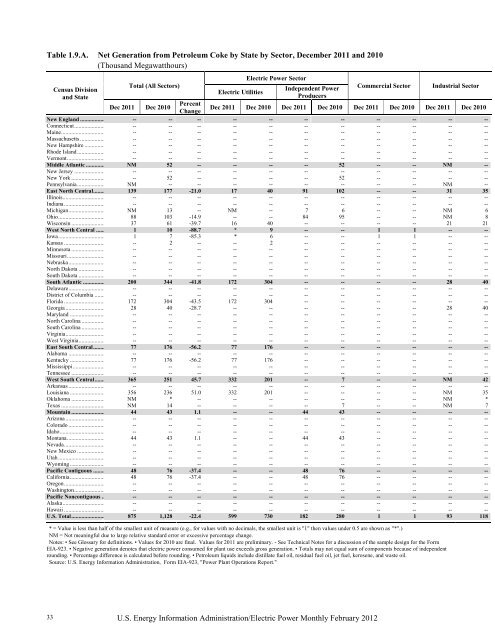
Table 1.9.A. Net Generation from Petroleum Coke by State by Sector, December 2011 and 2010<br />
(Thousand Megawatthours)<br />
33<br />
Census Division<br />
and State<br />
Total (All Sectors)<br />
<strong>Electric</strong> Utilities<br />
<strong>Electric</strong> <strong>Power</strong> Sector<br />
Independent <strong>Power</strong><br />
Producers<br />
U.S. Energy Information Administration/<strong>Electric</strong> <strong>Power</strong> <strong>Monthly</strong> <strong>February</strong> <strong>2012</strong><br />
Commercial Sector Industrial Sector<br />
Dec 2011 Dec 2010 Percent<br />
Change<br />
Dec 2011 Dec 2010 Dec 2011 Dec 2010 Dec 2011 Dec 2010 Dec 2011 Dec 2010<br />
New England ................. -- -- -- -- -- -- -- -- -- -- --<br />
Connecticut ..................... -- -- -- -- -- -- -- -- -- -- --<br />
Maine .............................. -- -- -- -- -- -- -- -- -- -- --<br />
Massachusetts ................. -- -- -- -- -- -- -- -- -- -- --<br />
New Hampshire .............. -- -- -- -- -- -- -- -- -- -- --<br />
Rhode Island ................... -- -- -- -- -- -- -- -- -- -- --<br />
Vermont .......................... -- -- -- -- -- -- -- -- -- -- --<br />
Middle Atlantic ............. NM 52 -- -- -- -- 52 -- -- NM --<br />
New Jersey ..................... -- -- -- -- -- -- -- -- -- -- --<br />
New York ....................... -- 52 -- -- -- -- 52 -- -- -- --<br />
Pennsylvania ................... NM -- -- -- -- -- -- -- -- NM --<br />
East North Central........ 139 177 -21.0 17 40 91 102 -- -- 31 35<br />
Illinois............................. -- -- -- -- -- -- -- -- -- -- --<br />
Indiana ............................ -- -- -- -- -- -- -- -- -- -- --<br />
Michigan ......................... NM 13 -- NM -- 7 6 -- -- NM 6<br />
Ohio ................................ 88 103 -14.9 -- -- 84 95 -- -- NM 8<br />
Wisconsin ....................... 37 61 -39.7 16 40 -- -- -- -- 21 21<br />
West North Central ...... 1 10 -88.7 * 9 -- -- 1 1 -- --<br />
Iowa ................................ 1 7 -85.3 * 6 -- -- 1 1 -- --<br />
Kansas ............................ -- 2 -- -- 2 -- -- -- -- -- --<br />
Minnesota ....................... -- -- -- -- -- -- -- -- -- -- --<br />
Missouri .......................... -- -- -- -- -- -- -- -- -- -- --<br />
Nebraska ......................... -- -- -- -- -- -- -- -- -- -- --<br />
North Dakota .................. -- -- -- -- -- -- -- -- -- -- --<br />
South Dakota .................. -- -- -- -- -- -- -- -- -- -- --<br />
South Atlantic ............... 200 344 -41.8 172 304 -- -- -- -- 28 40<br />
Delaware ......................... -- -- -- -- -- -- -- -- -- -- --<br />
District of Columbia ....... -- -- -- -- -- -- -- -- -- -- --<br />
Florida ............................ 172 304 -43.5 172 304 -- -- -- -- -- --<br />
Georgia ........................... 28 40 -28.7 -- -- -- -- -- -- 28 40<br />
Maryland ........................ -- -- -- -- -- -- -- -- -- -- --<br />
North Carolina ................ -- -- -- -- -- -- -- -- -- -- --<br />
South Carolina ................ -- -- -- -- -- -- -- -- -- -- --<br />
Virginia ........................... -- -- -- -- -- -- -- -- -- -- --<br />
West Virginia .................. -- -- -- -- -- -- -- -- -- -- --<br />
East South Central ........ 77 176 -56.2 77 176 -- -- -- -- -- --<br />
Alabama ......................... -- -- -- -- -- -- -- -- -- -- --<br />
Kentucky ........................ 77 176 -56.2 77 176 -- -- -- -- -- --<br />
Mississippi ...................... -- -- -- -- -- -- -- -- -- -- --<br />
Tennessee ....................... -- -- -- -- -- -- -- -- -- -- --<br />
West South Central ....... 365 251 45.7 332 201 -- 7 -- -- NM 42<br />
Arkansas ......................... -- -- -- -- -- -- -- -- -- -- --<br />
Louisiana ........................ 356 236 51.0 332 201 -- -- -- -- NM 35<br />
Oklahoma ....................... NM * -- -- -- -- -- -- -- NM *<br />
Texas .............................. NM 14 -- -- -- -- 7 -- -- NM 7<br />
Mountain ....................... 44 43 1.1 -- -- 44 43 -- -- -- --<br />
Arizona ........................... -- -- -- -- -- -- -- -- -- -- --<br />
Colorado ......................... -- -- -- -- -- -- -- -- -- -- --<br />
Idaho ............................... -- -- -- -- -- -- -- -- -- -- --<br />
Montana .......................... 44 43 1.1 -- -- 44 43 -- -- -- --<br />
Nevada ............................ -- -- -- -- -- -- -- -- -- -- --<br />
New Mexico ................... -- -- -- -- -- -- -- -- -- -- --<br />
Utah ................................ -- -- -- -- -- -- -- -- -- -- --<br />
Wyoming ........................ -- -- -- -- -- -- -- -- -- -- --<br />
Pacific Contiguous ........ 48 76 -37.4 -- -- 48 76 -- -- -- --<br />
California ........................ 48 76 -37.4 -- -- 48 76 -- -- -- --<br />
Oregon ............................ -- -- -- -- -- -- -- -- -- -- --<br />
Washington ..................... -- -- -- -- -- -- -- -- -- -- --<br />
Pacific Noncontiguous .. -- -- -- -- -- -- -- -- -- -- --<br />
Alaska ............................. -- -- -- -- -- -- -- -- -- -- --<br />
Hawaii ............................ -- -- -- -- -- -- -- -- -- -- --<br />
U.S. Total ....................... 875 1,128 -22.4 599 730 182 280 1 1 93 118<br />
* = Value is less than half of the smallest unit of measure (e.g., for values with no decimals, the smallest unit is "1" then values under 0.5 are shown as "*".)<br />
NM = Not meaningful due to large relative standard error or excessive percentage change.<br />
Notes: • See Glossary for definitions. • Values for 2010 are final. Values for 2011 are preliminary. - See Technical Notes for a discussion of the sample design for the Form<br />
<strong>EIA</strong>-923. • Negative generation denotes that electric power consumed for plant use exceeds gross generation. • Totals may not equal sum of components because of independent<br />
rounding. • Percentage difference is calculated before rounding. • Petroleum liquids include distillate fuel oil, residual fuel oil, jet fuel, kerosene, and waste oil.<br />
Source: U.S. Energy Information Administration, Form <strong>EIA</strong>-923, "<strong>Power</strong> Plant Operations Report."


