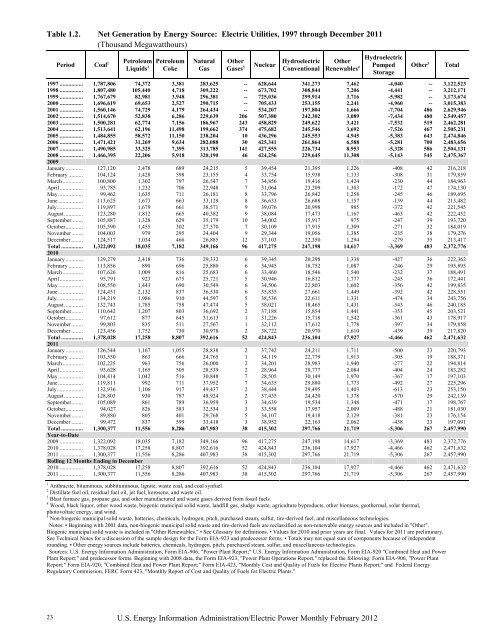
Table 1.2. Net Generation by Energy Source: <strong>Electric</strong> Utilities, 1997 through December 2011 (Thousand Megawatthours) 23 Period Coal 1 Petroleum Liquids 2 Petroleum Coke Natural Gas Other Gases 3 Hydroelectric Nuclear Conventional Other Renewables 4 U.S. Energy Information Administration/<strong>Electric</strong> <strong>Power</strong> <strong>Monthly</strong> <strong>February</strong> <strong>2012</strong> Hydroelectric Pumped Storage Other 5 Total 1997 ................ 1,787,806 74,372 3,381 283,625 -- 628,644 341,273 7,462 -4,040 -- 3,122,523 1998 ................ 1,807,480 105,440 4,718 309,222 -- 673,702 308,844 7,206 -4,441 -- 3,212,171 1999 ................ 1,767,679 82,981 3,948 296,381 -- 725,036 299,914 3,716 -5,982 -- 3,173,674 2000 ................ 1,696,619 69,653 2,527 290,715 -- 705,433 253,155 2,241 -4,960 -- 3,015,383 2001 ................ 1,560,146 74,729 4,179 264,434 -- 534,207 197,804 1,666 -7,704 486 2,629,946 2002 ................ 1,514,670 52,838 6,286 229,639 206 507,380 242,302 3,089 -7,434 480 2,549,457 2003 ................ 1,500,281 62,774 7,156 186,967 243 458,829 249,622 3,421 -7,532 519 2,462,281 2004 ................ 1,513,641 62,196 11,498 199,662 374 475,682 245,546 3,692 -7,526 467 2,505,231 2005 ................ 1,484,855 58,572 11,150 238,204 10 436,296 245,553 4,945 -5,383 643 2,474,846 2006 ................ 1,471,421 31,269 9,634 282,088 30 425,341 261,864 6,588 -5,281 700 2,483,656 2007 ................ 1,490,985 33,325 7,395 313,785 141 427,555 226,734 8,953 -5,328 586 2,504,131 2008 ................ 1,466,395 22,206 5,918 320,190 46 424,256 229,645 11,308 -5,143 545 2,475,367 2009 January ............ 127,120 2,478 689 24,215 5 39,454 21,395 1,226 -408 42 216,218 <strong>February</strong> .......... 104,124 1,428 598 23,155 4 33,754 15,938 1,133 -308 31 179,859 March .............. 100,800 1,302 797 26,547 7 34,856 19,416 1,424 -230 44 184,963 April ................ 93,785 1,232 706 22,948 7 31,064 23,209 1,303 -172 47 174,130 May ................. 99,462 1,635 711 26,181 8 33,796 26,842 1,258 -245 46 189,695 June ................. 113,625 1,673 663 33,129 8 36,633 26,688 1,157 -139 44 213,482 July .................. 119,897 1,679 661 38,571 9 39,076 20,998 985 -372 42 221,545 August ............. 123,280 1,812 665 40,382 9 38,084 17,473 1,167 -463 42 222,452 September........ 105,887 1,328 629 35,179 10 34,002 15,917 975 -247 39 193,720 October ............ 105,590 1,455 302 27,570 7 30,109 17,915 1,309 -271 32 184,019 November ........ 104,003 979 295 24,404 9 29,344 19,056 1,385 -235 38 179,276 December ........ 124,517 1,034 466 26,885 12 37,103 22,350 1,294 -279 35 213,417 Total ............... 1,322,092 18,035 7,182 349,166 96 417,275 247,198 14,617 -3,369 483 2,372,776 2010 January ............ 129,279 2,418 736 29,332 6 39,345 20,298 1,338 -427 36 222,362 <strong>February</strong> .......... 113,856 890 696 25,880 6 34,945 18,752 1,087 -246 29 195,895 March .............. 107,626 1,009 816 25,683 6 33,460 18,546 1,540 -232 37 188,491 April ................ 95,791 923 675 25,721 5 30,946 16,812 1,777 -245 36 172,441 May ................. 108,550 1,443 690 30,549 6 34,506 22,803 1,602 -356 42 199,835 June ................. 124,451 2,132 837 36,530 6 35,835 27,661 1,449 -392 42 228,551 July .................. 134,219 1,986 910 44,597 5 38,536 22,611 1,331 -474 34 243,756 August ............. 132,743 1,785 758 47,474 5 38,021 18,465 1,431 -543 46 240,185 September........ 110,642 1,207 803 36,692 2 37,188 15,854 1,441 -353 45 203,521 October ............ 97,612 877 645 31,613 1 31,226 15,718 1,542 -361 43 178,917 November ........ 99,803 835 511 27,567 1 32,112 17,612 1,778 -397 34 179,858 December ........ 123,456 1,752 730 30,978 2 38,722 20,970 1,610 -439 39 217,820 Total ............... 1,378,028 17,258 8,807 392,616 52 424,843 236,104 17,927 -4,466 462 2,471,632 2011 January ............ 126,544 1,167 1,055 28,838 2 37,742 24,211 1,711 -500 23 220,793 <strong>February</strong> .......... 103,550 863 666 24,765 1 34,119 22,779 1,913 -305 19 188,371 March .............. 102,225 963 756 26,000 2 34,201 28,983 1,940 -277 22 194,814 April ................ 93,628 1,165 505 28,539 2 28,964 28,777 2,084 -404 24 183,282 May ................. 104,414 1,042 516 30,848 7 28,505 30,149 1,970 -367 17 197,103 June ................. 119,811 992 711 37,952 7 34,635 29,880 1,773 -492 27 225,296 July .................. 132,936 1,106 917 49,437 2 38,444 29,495 1,403 -613 23 253,150 August ............. 128,803 930 787 48,924 2 37,435 24,420 1,378 -570 29 242,139 September........ 105,089 861 789 36,959 3 34,639 19,534 1,348 -471 17 198,767 October ............ 94,027 826 583 32,534 3 33,558 17,957 2,009 -488 21 181,030 November ........ 89,880 805 401 29,768 5 34,107 19,418 2,129 -381 23 176,154 December ........ 99,472 837 599 33,418 3 38,952 22,163 2,062 -438 23 197,091 Total ............... 1,300,377 11,556 8,286 407,983 38 415,302 297,766 21,719 -5,306 267 2,457,990 Year-to-Date 2009 ................ 1,322,092 18,035 7,182 349,166 96 417,275 247,198 14,617 -3,369 483 2,372,776 2010 ................ 1,378,028 17,258 8,807 392,616 52 424,843 236,104 17,927 -4,466 462 2,471,632 2011 ................ 1,300,377 11,556 8,286 407,983 38 415,302 297,766 21,719 -5,306 267 2,457,990 Rolling 12 Months Ending in December 2010 ................ 1,378,028 17,258 8,807 392,616 52 424,843 236,104 17,927 -4,466 462 2,471,632 2011 ................ 1,300,377 11,556 8,286 407,983 38 415,302 297,766 21,719 -5,306 267 2,457,990 1 Anthracite, bituminous, subbituminous, lignite, waste coal, and coal synfuel. 2 Distillate fuel oil, residual fuel oil, jet fuel, kerosene, and waste oil. 3 Blast furnace gas, propane gas, and other manufactured and waste gases derived from fossil fuels. 4 Wood, black liquor, other wood waste, biogenic municipal solid waste, landfill gas, sludge waste, agriculture byproducts, other biomass, geothermal, solar thermal, photovoltaic energy, and wind. 5 Non-biogenic municipal solid waste, batteries, chemicals, hydrogen, pitch, purchased steam, sulfur, tire-derived fuel, and miscellaneous technologies. Notes: • Beginning with 2001 data, non-biogenic municipal solid waste and tire-derived fuels are reclassified as non-renewable energy sources and included in "Other". Biogenic municipal solid waste is included in "Other Renewables." • See Glossary for definitions. • Values for 2010 and prior years are final. Values for 2011 are preliminary. See Technical Notes for a discussion of the sample design for the Form <strong>EIA</strong>-923 and predecessor forms. • Totals may not equal sum of components because of independent rounding. • Other energy sources include batteries, chemicals, hydrogen, pitch, purchased steam, sulfur, and miscellaneous technologies. Sources: U.S. Energy Information Administration, Form <strong>EIA</strong>-906, "<strong>Power</strong> Plant Report;" U.S. Energy Information Administration, Form <strong>EIA</strong>-920 "Combined Heat and <strong>Power</strong> Plant Report;" and predecessor forms. Beginning with 2008 data, the Form <strong>EIA</strong>-923, "<strong>Power</strong> Plant Operations Report," replaced the following: Form <strong>EIA</strong>-906, "<strong>Power</strong> Plant Report;" Form <strong>EIA</strong>-920, "Combined Heat and <strong>Power</strong> Plant Report;" Form <strong>EIA</strong>-423, "<strong>Monthly</strong> Cost and Quality of Fuels for <strong>Electric</strong> Plants Report;" and Federal Energy Regulatory Commission, FERC Form 423, "<strong>Monthly</strong> Report of Cost and Quality of Fuels for <strong>Electric</strong> Plants."
Table 1.3. Net Generation by Energy Source: Independent <strong>Power</strong> Producers, 1997 through December 2011 (Thousand Megawatthours) Period Coal 1 Petroleum Liquids 2 Petroleum Coke Natural Gas Other Gases 3 Hydroelectric Nuclear Conventional Other Renewables 4 U.S. Energy Information Administration/<strong>Electric</strong> <strong>Power</strong> <strong>Monthly</strong> <strong>February</strong> <strong>2012</strong> Hydroelectric Pumped Storage Other 5 Total 1997 ................ 32,955 3,976 4,751 115,971 1,533 -- 9,375 38,228 -- 63 206,852 1998 ................ 42,713 6,525 5,528 140,070 2,315 -- 9,023 38,937 -26 159 245,245 1999 ................ 90,938 19,635 4,975 176,615 1,607 3,218 14,749 44,548 -115 139 356,309 2000 ................ 246,492 27,929 5,083 227,263 2,028 48,460 18,183 47,162 -579 125 622,146 2001 ................ 322,681 35,532 4,709 290,506 586 234,619 15,945 40,593 -1,119 6,055 950,107 2002 ................ 395,943 22,241 8,368 378,044 1,763 272,684 18,189 44,466 -1,309 8,612 1,149,001 2003 ................ 452,433 35,818 7,949 380,337 2,404 304,904 21,890 46,060 -1,003 8,088 1,258,879 2004 ................ 443,547 33,574 7,410 427,510 3,194 312,846 19,518 48,636 -962 7,856 1,303,129 2005 ................ 507,199 37,096 9,664 445,625 3,767 345,690 21,486 51,708 -1,174 6,285 1,427,346 2006 ................ 498,316 10,396 8,409 452,329 4,223 361,877 24,390 59,345 -1,277 6,412 1,424,421 2007 ................ 507,406 13,645 6,942 500,967 3,901 378,869 19,109 65,751 -1,569 6,191 1,501,212 2008 ................ 502,442 8,021 6,737 482,182 3,154 381,952 23,451 85,776 -1,145 6,414 1,498,982 2009 January ............ 43,505 2,242 327 35,753 214 34,648 1,922 8,266 -94 514 127,298 <strong>February</strong> .......... 35,619 646 327 33,009 208 30,473 1,724 7,998 -105 464 110,362 March .............. 33,514 624 354 35,290 232 32,385 2,208 9,259 -85 514 114,294 April ................ 31,018 280 340 32,352 224 28,344 2,361 9,531 -100 514 104,864 May ................. 31,064 281 338 35,944 226 31,599 2,522 8,422 -104 509 110,801 June ................. 33,220 282 376 44,462 245 33,101 2,368 8,040 -87 523 122,529 July .................. 37,046 341 430 55,916 279 33,873 2,245 7,741 -119 545 138,296 August ............. 38,636 526 388 61,254 269 34,161 1,970 8,081 -150 552 145,687 September........ 30,063 245 405 49,763 288 31,749 1,346 7,180 -101 506 121,443 October ............ 33,077 271 312 38,282 272 27,912 1,637 8,933 -114 490 111,073 November ........ 31,641 247 326 32,331 247 29,725 1,809 9,015 -94 489 105,735 December ........ 40,629 323 367 37,482 256 33,608 2,198 9,393 -105 527 124,678 Total ............... 419,031 6,306 4,288 491,839 2,962 381,579 24,308 101,860 -1,259 6,146 1,437,061 2010 January ............ 42,381 655 302 37,515 269 33,224 1,909 9,142 -138 507 125,766 <strong>February</strong> .......... 37,605 266 314 33,676 241 30,300 1,669 7,669 -105 463 112,099 March .............. 35,039 192 281 30,809 269 31,174 2,145 10,760 -93 502 111,080 April ................ 29,824 228 283 32,403 268 26,666 2,087 11,509 -91 505 103,681 May ................. 33,119 333 335 36,313 273 32,152 2,100 10,747 -84 533 115,821 June ................. 39,461 459 364 48,503 259 32,466 2,050 10,402 -80 550 134,434 July .................. 43,559 900 403 62,363 262 33,377 1,794 9,305 -83 558 152,439 August ............. 43,105 568 265 65,487 244 33,553 1,554 9,193 -57 553 154,465 September........ 36,515 401 197 48,806 238 32,183 1,334 9,391 -68 540 129,537 October ............ 33,051 267 248 39,263 169 31,525 1,843 9,914 -77 527 116,729 November ........ 34,012 310 224 34,738 218 30,543 1,813 11,642 -70 545 113,975 December ........ 42,038 540 280 38,897 205 34,962 2,054 11,282 -91 562 130,729 Total ............... 449,709 5,117 3,497 508,774 2,915 382,126 22,351 120,956 -1,035 6,345 1,500,754 2011 January ............ 42,613 575 260 38,200 245 35,000 1,790 10,733 74 491 129,982 <strong>February</strong> .......... 33,203 244 268 34,422 204 30,670 1,738 12,096 58 462 113,364 March .............. 30,939 225 338 33,350 249 31,461 2,554 12,510 -72 565 112,118 April ................ 29,439 226 216 35,169 248 25,583 2,645 13,970 -63 566 108,000 May ................. 31,380 251 243 37,719 243 28,511 2,739 13,519 -51 563 115,117 June ................. 36,866 347 226 46,080 275 30,635 2,217 13,118 -76 585 130,274 July .................. 41,914 538 278 63,328 294 33,901 1,947 10,150 -96 615 152,869 August ............. 40,769 302 224 63,066 291 33,903 1,796 10,075 -94 587 150,920 September........ 34,369 240 185 47,433 285 32,210 1,841 9,339 -83 536 126,354 October ............ 31,174 205 177 39,873 276 29,796 1,947 12,364 -84 535 116,264 November ........ 29,988 199 193 38,649 237 30,367 1,803 13,883 -60 542 115,801 December ........ 31,840 238 182 45,296 263 32,885 2,358 12,408 -59 601 126,012 Total ............... 414,493 3,590 2,791 522,585 3,110 374,923 25,375 144,166 -607 6,649 1,497,075 Year-to-Date 2009 ................ 419,031 6,306 4,288 491,839 2,962 381,579 24,308 101,860 -1,259 6,146 1,437,061 2010 ................ 449,709 5,117 3,497 508,774 2,915 382,126 22,351 120,956 -1,035 6,345 1,500,754 2011 ................ 414,493 3,590 2,791 522,585 3,110 374,923 25,375 144,166 -607 6,649 1,497,075 Rolling 12 Months Ending in December 2010 ................ 449,709 5,117 3,497 508,774 2,915 382,126 22,351 120,956 -1,035 6,345 1,500,754 2011 ................ 414,493 3,590 2,791 522,585 3,110 374,923 25,375 144,166 -607 6,649 1,497,075 1 Anthracite, bituminous, subbituminous, lignite, waste coal, and coal synfuel. 2 Distillate fuel oil, residual fuel oil, jet fuel, kerosene, and waste oil. 3 Blast furnace gas, propane gas, and other manufactured and waste gases derived from fossil fuels. 4 Wood, black liquor, other wood waste, biogenic municipal solid waste, landfill gas, sludge waste, agriculture byproducts, other biomass, geothermal, solar thermal, photovoltaic energy, and wind. 5 Non-biogenic municipal solid waste, batteries, chemicals, hydrogen, pitch, purchased steam, sulfur, tire-derived fuel, and miscellaneous technologies. Notes: • Beginning with 2001 data, non-biogenic municipal solid waste and tire-derived fuels are reclassified as non-renewable energy sources and included in "Other". Biogenic municipal solid waste is included in "Other Renewables." • Beginning with the collection of Form <strong>EIA</strong>-923 in January 2008, the methodology to allocate total fuel consumption for electricity generation and consumption for useful thermal output was changed. The new methodology was retroactively applied to 2004-2007. See the Technical Notes (Appendix C) for further information. • See Glossary for definitions. • Values for 2010 and prior years are final. Values for 2011 are preliminary. See Technical Notes for a discussion of the sample design for the Form <strong>EIA</strong>-923 and predecessor forms. • Totals may not equal sum of components because of independent rounding. Sources: U.S. Energy Information Administration, Form <strong>EIA</strong>-906, "<strong>Power</strong> Plant Report;" U.S. Energy Information Administration, Form <strong>EIA</strong>-920 "Combined Heat and <strong>Power</strong> Plant Report;" and predecessor forms. Beginning with 2008 data, the Form <strong>EIA</strong>-923, "<strong>Power</strong> Plant Operations Report," replaced the following: Form <strong>EIA</strong>-906, "<strong>Power</strong> Plant Report;" Form <strong>EIA</strong>-920, "Combined Heat and <strong>Power</strong> Plant Report;" Form <strong>EIA</strong>-423, "<strong>Monthly</strong> Cost and Quality of Fuels for <strong>Electric</strong> Plants Report;" and Federal Energy Regulatory Commission, FERC Form 423, "<strong>Monthly</strong> Report of Cost and Quality of Fuels for <strong>Electric</strong> Plants." 24
- Page 1 and 2: Electric Power Monthly February 201
- Page 3 and 4: The Electric Power Monthly (EPM) pr
- Page 5 and 6: Table Index Executive Summary .....
- Page 7 and 8: Table 3.4. Stocks of Coal by Coal R
- Page 9 and 10: Table A5.B. Relative Standard Error
- Page 11 and 12: Table ES1.A. Total Electric Power I
- Page 13 and 14: Table ES2.A. Summary Statistics: Re
- Page 15 and 16: Table ES3. New U.S. Electric Genera
- Page 17 and 18: Table ES3. New U.S. Electric Genera
- Page 19 and 20: Table ES3. New U.S. Electric Genera
- Page 21 and 22: Table ES3. New U.S. Electric Genera
- Page 23 and 24: Table ES3. New U.S. Electric Genera
- Page 25 and 26: Table ES3. New U.S. Electric Genera
- Page 27 and 28: Table ES4. Retired U.S. Electric Ge
- Page 29 and 30: Chapter 1. Net Generation U.S. Ener
- Page 31: Table 1.1.A. Net Generation by Othe
- Page 35 and 36: Table 1.5. Net Generation by Energy
- Page 37 and 38: Table 1.6.B. Net Generation by Stat
- Page 39 and 40: Table 1.7.B. Net Generation from Co
- Page 41 and 42: Table 1.8.B. Net Generation from Pe
- Page 43 and 44: Table 1.9.B. Net Generation from Pe
- Page 45 and 46: Table 1.10.B. Net Generation from N
- Page 47 and 48: Table 1.11.B. Net Generation from O
- Page 49 and 50: Table 1.12.B. Net Generation from N
- Page 51 and 52: Table 1.13.B. Net Generation from H
- Page 53 and 54: Table 1.14.B. Net Generation from O
- Page 55 and 56: Table 1.15.B. Net Generation from H
- Page 57 and 58: Table 1.16.B. Net Generation from O
- Page 59 and 60: Table 1.17.B. Net Generation from W
- Page 61 and 62: Table 1.18.B. Net Generation from B
- Page 63 and 64: Table 1.20.A. Net Generation from S
- Page 65 and 66: Table 2.1.A. Coal: Consumption for
- Page 67 and 68: Table 2.1.C. Coal: Consumption for
- Page 69 and 70: Table 2.2.B. Petroleum Liquids: Con
- Page 71 and 72: Table 2.3.A. Petroleum Coke: Consum
- Page 73 and 74: Table 2.3.C. Petroleum Coke: Consum
- Page 75 and 76: Table 2.4.B. Natural Gas: Consumpti
- Page 77 and 78: Table 2.5.A. Consumption of Coal fo
- Page 79 and 80: Table 2.6.A. Consumption of Petrole
- Page 81 and 82: Table 2.7.A. Consumption of Petrole
- Page 83 and 84:
Table 2.8.A. Consumption of Natural
- Page 85 and 86:
Chapter 3. Fossil-Fuel Stocks for E
- Page 87 and 88:
Table 3.2. Stocks of Coal, Petroleu
- Page 89 and 90:
Table 3.4. Stocks of Coal by Coal R
- Page 91 and 92:
Table 4.1. Receipts, Average Cost,
- Page 93 and 94:
Table 4.2. Receipts, Average Cost,
- Page 95 and 96:
Table 4.3. Receipts, Average Cost,
- Page 97 and 98:
Table 4.4. Receipts, Average Cost,
- Page 99 and 100:
Table 4.5. Receipts, Average Cost,
- Page 101 and 102:
Table 4.6.A. Receipts of Coal Deliv
- Page 103 and 104:
Table 4.7.A. Receipts of Petroleum
- Page 105 and 106:
Table 4.8.A. Receipts of Petroleum
- Page 107 and 108:
Table 4.9.A. Receipts of Natural Ga
- Page 109 and 110:
Table 4.10.A. Average Cost of Coal
- Page 111 and 112:
Table 4.11.A. Average Cost of Petro
- Page 113 and 114:
Table 4.12.A. Average Cost of Petro
- Page 115 and 116:
Table 4.13.A. Average Cost of Natur
- Page 117 and 118:
Table 4.14. Receipts and Quality of
- Page 119 and 120:
Table 4.16. Receipts and Quality of
- Page 121 and 122:
Table 4.18. Receipts and Quality of
- Page 123 and 124:
Table 5.1. Retail Sales of Electric
- Page 125 and 126:
Table 5.3. Average Retail Price of
- Page 127 and 128:
Table 5.4.B. Retail Sales of Electr
- Page 129 and 130:
Table 5.5.B. Revenue from Retail Sa
- Page 131 and 132:
Table 5.6.B. Average Retail Price o
- Page 133 and 134:
Appendix A Relative Standard Error
- Page 135 and 136:
Table A1.B. Relative Standard Error
- Page 137 and 138:
Table A2.A. Relative Standard Error
- Page 139 and 140:
Table A2.B. Relative Standard Error
- Page 141 and 142:
Table A3.A. Relative Standard Error
- Page 143 and 144:
Table A3.B. Relative Standard Error
- Page 145 and 146:
Table A4.A. Relative Standard Error
- Page 147 and 148:
Table A4.B. Relative Standard Error
- Page 149 and 150:
Table A5.A. Relative Standard Error
- Page 151 and 152:
Table A5.B. Relative Standard Error
- Page 153 and 154:
Table A6.A. Relative Standard Error
- Page 155 and 156:
Table A7.A. Relative Standard Error
- Page 157 and 158:
Table A8.A. Relative Standard Error
- Page 159 and 160:
Appendix B Major Disturbances and U
- Page 161 and 162:
05/25/11 Duke Energy Midwest(RFC) 1
- Page 163 and 164:
Table B.1. Major Disturbances and U
- Page 165 and 166:
Table B.2. Major Disturbances and U
- Page 167 and 168:
Table B.2. Major Disturbances and U
- Page 169 and 170:
The Energy Information Administrati
- Page 171 and 172:
Data Sources For Electric Power Mon
- Page 173 and 174:
ate charged by the electric utility
- Page 175 and 176:
data only on fossil-steam plants, b
- Page 177 and 178:
contents of the components of MSW w
- Page 179 and 180:
Construction 23 Manufacturing 311 F
- Page 181 and 182:
Table C2. Comparison of Preliminary
- Page 183 and 184:
Table C4. Unit-of-Measure Equivalen
- Page 185 and 186:
20 Knaub, J.R., Jr. (2003), “Appl
- Page 187 and 188:
such as briquettes, pellets, or ext
- Page 189 and 190:
order to provide, distribute, and s
- Page 191 and 192:
station(s) for station service or a
- Page 193:
concentrations of 1 percent or less