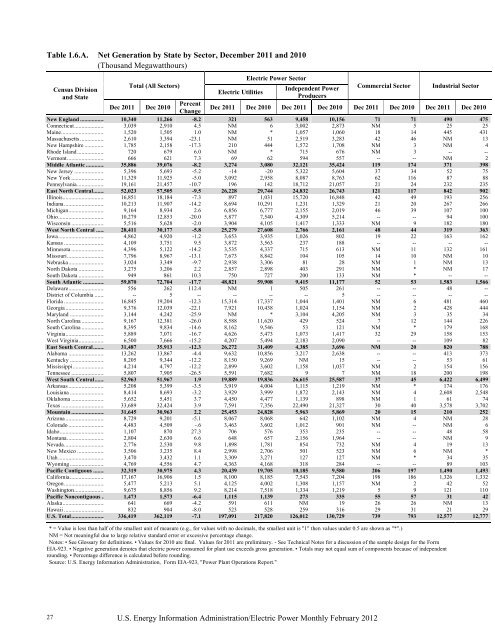
Table 1.6.A. Net Generation by State by Sector, December 2011 and 2010 (Thousand Megawatthours) 27 Census Division and State Total (All Sectors) <strong>Electric</strong> Utilities <strong>Electric</strong> <strong>Power</strong> Sector Independent <strong>Power</strong> Producers U.S. Energy Information Administration/<strong>Electric</strong> <strong>Power</strong> <strong>Monthly</strong> <strong>February</strong> <strong>2012</strong> Commercial Sector Industrial Sector Dec 2011 Dec 2010 Percent Change Dec 2011 Dec 2010 Dec 2011 Dec 2010 Dec 2011 Dec 2010 Dec 2011 Dec 2010 New England ................. 10,340 11,266 -8.2 321 563 9,458 10,156 71 71 490 475 Connecticut ..................... 3,039 2,910 4.5 NM 6 3,002 2,873 NM 5 25 25 Maine .............................. 1,520 1,505 1.0 NM * 1,057 1,060 18 14 445 431 Massachusetts ................. 2,610 3,394 -23.1 NM 51 2,519 3,283 42 46 NM 13 New Hampshire .............. 1,785 2,158 -17.3 210 444 1,572 1,708 NM 3 NM 4 Rhode Island ................... 720 679 6.0 NM * 715 676 NM 3 -- -- Vermont .......................... 666 621 7.3 69 62 594 557 -- -- NM 2 Middle Atlantic ............. 35,886 39,076 -8.2 3,274 3,080 32,121 35,424 119 174 371 398 New Jersey ..................... 5,396 5,693 -5.2 -14 -20 5,322 5,604 37 34 52 75 New York ....................... 11,329 11,925 -5.0 3,092 2,958 8,087 8,763 62 116 87 88 Pennsylvania ................... 19,161 21,457 -10.7 196 142 18,712 21,057 21 24 232 235 East North Central........ 52,023 57,505 -9.5 26,228 29,744 24,832 26,743 121 117 842 902 Illinois............................. 16,851 18,184 -7.3 897 1,031 15,720 16,848 42 49 193 256 Indiana ............................ 10,213 11,907 -14.2 8,694 10,291 1,231 1,329 21 20 267 266 Michigan ......................... 9,164 8,934 2.6 6,856 6,777 2,155 2,019 46 39 107 100 Ohio ................................ 10,279 12,853 -20.0 5,877 7,540 4,309 5,214 -- -- 94 100 Wisconsin ....................... 5,516 5,628 -2.0 3,904 4,105 1,417 1,333 NM 9 182 180 West North Central ...... 28,411 30,177 -5.8 25,279 27,608 2,766 2,161 48 44 319 363 Iowa ................................ 4,862 4,920 -1.2 3,653 3,935 1,026 802 19 22 163 162 Kansas ............................ 4,109 3,751 9.5 3,872 3,563 237 188 -- -- -- -- Minnesota ....................... 4,396 5,122 -14.2 3,535 4,337 715 613 NM 11 132 161 Missouri .......................... 7,796 8,967 -13.1 7,673 8,842 104 105 14 10 NM 10 Nebraska ......................... 3,024 3,349 -9.7 2,938 3,306 81 28 NM 1 NM 13 North Dakota .................. 3,275 3,206 2.2 2,857 2,898 403 291 NM * NM 17 South Dakota .................. 949 861 10.3 750 727 200 133 NM * -- -- South Atlantic ............... 59,870 72,704 -17.7 48,821 59,908 9,415 11,177 52 53 1,583 1,566 Delaware ......................... 556 262 112.4 NM 1 505 261 -- -- 48 -- District of Columbia ....... -- 5 -- -- -- -- 5 -- -- -- -- Florida ............................ 16,845 19,204 -12.3 15,314 17,337 1,044 1,401 NM 6 481 460 Georgia ........................... 9,376 12,039 -22.1 7,921 10,438 1,024 1,154 NM 2 428 444 Maryland ........................ 3,144 4,242 -25.9 NM * 3,104 4,205 NM 3 35 34 North Carolina ................ 9,167 12,381 -26.0 8,588 11,620 429 524 7 12 144 226 South Carolina ................ 8,395 9,834 -14.6 8,162 9,546 53 121 NM * 179 168 Virginia ........................... 5,889 7,071 -16.7 4,626 5,473 1,073 1,417 32 29 158 153 West Virginia .................. 6,500 7,666 -15.2 4,207 5,494 2,183 2,090 -- -- 109 82 East South Central ........ 31,487 35,913 -12.3 26,272 31,409 4,385 3,696 NM 20 820 788 Alabama ......................... 13,262 13,867 -4.4 9,632 10,856 3,217 2,638 -- -- 413 373 Kentucky ........................ 8,205 9,344 -12.2 8,150 9,269 NM 15 -- -- 53 61 Mississippi ...................... 4,214 4,797 -12.2 2,899 3,602 1,158 1,037 NM 2 154 156 Tennessee ....................... 5,807 7,905 -26.5 5,591 7,682 9 7 NM 18 200 198 West South Central ....... 52,963 51,967 1.9 19,889 19,836 26,615 25,587 37 45 6,422 6,499 Arkansas ......................... 5,208 5,399 -3.5 3,919 4,004 1,115 1,219 NM * 174 176 Louisiana ........................ 8,414 8,693 -3.2 3,929 3,999 1,872 2,143 NM 4 2,608 2,548 Oklahoma ....................... 5,652 5,451 3.7 4,450 4,477 1,139 898 NM 1 61 74 Texas .............................. 33,689 32,424 3.9 7,591 7,356 22,490 21,327 30 40 3,578 3,702 Mountain ....................... 31,645 30,963 2.2 25,453 24,828 5,963 5,869 20 15 210 252 Arizona ........................... 8,729 9,201 -5.1 8,067 8,068 642 1,102 NM 4 NM 28 Colorado ......................... 4,483 4,509 -.6 3,463 3,602 1,012 901 NM -- NM 6 Idaho ............................... 1,107 870 27.3 706 576 353 235 -- -- 48 58 Montana .......................... 2,804 2,630 6.6 648 657 2,156 1,964 -- -- NM 9 Nevada ............................ 2,776 2,530 9.8 1,898 1,781 854 732 NM 4 19 13 New Mexico ................... 3,506 3,235 8.4 2,998 2,706 501 523 NM 6 NM * Utah ................................ 3,470 3,432 1.1 3,309 3,271 127 127 NM * 34 35 Wyoming ........................ 4,769 4,556 4.7 4,363 4,168 318 284 -- -- 89 103 Pacific Contiguous ........ 32,319 30,975 4.3 20,439 19,705 10,185 9,580 206 197 1,490 1,493 California ........................ 17,167 16,906 1.5 8,100 8,185 7,543 7,204 198 186 1,326 1,332 Oregon ............................ 5,477 5,213 5.1 4,125 4,002 1,308 1,157 NM 2 42 52 Washington ..................... 9,675 8,856 9.2 8,214 7,518 1,334 1,219 5 9 121 110 Pacific Noncontiguous .. 1,473 1,573 -6.4 1,115 1,139 273 335 55 57 31 42 Alaska ............................. 641 669 -4.2 591 611 NM 19 26 26 NM 13 Hawaii ............................ 832 904 -8.0 523 528 259 316 29 31 21 29 U.S. Total ....................... 336,419 362,119 -7.1 197,091 217,820 126,012 130,729 739 793 12,577 12,777 * = Value is less than half of the smallest unit of measure (e.g., for values with no decimals, the smallest unit is "1" then values under 0.5 are shown as "*".) NM = Not meaningful due to large relative standard error or excessive percentage change. Notes: • See Glossary for definitions. • Values for 2010 are final. Values for 2011 are preliminary. - See Technical Notes for a discussion of the sample design for the Form <strong>EIA</strong>-923. • Negative generation denotes that electric power consumed for plant use exceeds gross generation. • Totals may not equal sum of components because of independent rounding. • Percentage difference is calculated before rounding. Source: U.S. Energy Information Administration, Form <strong>EIA</strong>-923, "<strong>Power</strong> Plant Operations Report."
Table 1.6.B. Net Generation by State by Sector, Year-to-Date through December 2011 and 2010 (Thousand Megawatthours) Census Division and State Total (All Sectors) <strong>Electric</strong> Utilities <strong>Electric</strong> <strong>Power</strong> Sector Independent <strong>Power</strong> Producers U.S. Energy Information Administration/<strong>Electric</strong> <strong>Power</strong> <strong>Monthly</strong> <strong>February</strong> <strong>2012</strong> Commercial Sector Industrial Sector 2011 2010 Percent Change 2011 2010 2011 2010 2011 2010 2011 2010 New England ................. 123,434 129,728 -4.9 4,307 5,581 112,840 117,860 846 796 5,442 5,490 Connecticut ..................... 33,603 33,350 .8 69 66 33,165 32,908 66 70 302 306 Maine .............................. 15,778 17,019 -7.3 NM 2 10,675 11,881 211 179 4,891 4,957 Massachusetts ................. 38,371 42,805 -10.4 554 803 37,128 41,336 499 497 190 169 New Hampshire .............. 20,141 22,196 -9.3 2,984 3,979 17,109 18,163 16 20 NM 34 Rhode Island ................... 8,771 7,739 13.3 11 11 8,706 7,696 54 32 -- -- Vermont .......................... 6,771 6,620 2.3 687 721 6,056 5,874 -- -- NM 25 Middle Atlantic ............. 430,041 432,396 -.5 37,219 35,533 387,160 391,064 1,303 1,423 4,359 4,376 New Jersey ..................... 64,456 65,682 -1.9 -170 -186 63,634 64,727 384 402 607 740 New York ....................... 137,346 136,962 .3 35,646 34,633 100,055 100,516 651 765 994 1,047 Pennsylvania ................... 228,239 229,752 -.7 1,743 1,086 223,472 225,821 268 256 2,757 2,588 East North Central........ 628,915 645,996 -2.6 332,647 347,716 285,162 286,667 1,424 1,433 9,681 10,180 Illinois............................. 198,989 201,352 -1.2 11,680 12,418 184,537 185,763 437 432 2,334 2,738 Indiana ............................ 120,761 125,181 -3.5 103,471 107,853 13,970 13,989 227 235 3,093 3,105 Michigan ......................... 109,408 111,551 -1.9 86,195 89,667 21,387 20,045 628 624 1,199 1,215 Ohio ................................ 135,652 143,598 -5.5 85,367 92,198 49,294 50,374 -- -- 991 1,026 Wisconsin ....................... 64,105 64,314 -.3 45,934 45,580 15,974 16,496 132 142 2,064 2,096 West North Central ...... 333,111 332,835 .1 298,757 303,334 30,047 25,134 469 519 3,838 3,849 Iowa ................................ 56,938 57,509 -1.0 43,886 46,189 10,898 9,316 184 239 1,970 1,765 Kansas ............................ 45,565 47,924 -4.9 42,810 45,270 2,755 2,654 -- -- -- -- Minnesota ....................... 53,573 53,670 -.2 44,529 45,429 7,319 6,469 127 143 1,598 1,630 Missouri .......................... 95,088 92,313 3.0 92,817 90,177 2,062 1,897 146 125 63 114 Nebraska ......................... 34,950 36,630 -4.6 34,106 36,243 793 214 12 13 39 160 North Dakota .................. 34,940 34,740 .6 30,737 31,344 4,037 3,216 NM * 167 180 South Dakota .................. 12,056 10,050 20.0 9,873 8,682 2,183 1,367 NM * -- -- South Atlantic ............... 765,116 802,695 -4.7 628,727 664,005 118,574 120,707 593 573 17,221 17,410 Delaware ......................... 6,548 5,628 16.4 NM 30 6,230 5,598 -- -- 285 -- District of Columbia ....... 130 200 -35.1 -- -- 130 200 -- -- -- -- Florida ............................ 223,985 229,096 -2.2 202,121 206,062 16,462 17,501 73 69 5,329 5,464 Georgia ........................... 125,094 137,577 -9.1 107,084 120,426 13,242 12,293 23 23 4,745 4,835 Maryland ........................ 41,913 43,607 -3.9 9 3 41,449 43,115 46 40 409 449 North Carolina ................ 118,126 128,678 -8.2 110,621 121,251 5,695 5,203 63 78 1,746 2,146 South Carolina ................ 103,246 104,153 -.9 99,946 100,611 1,347 1,804 NM 2 1,951 1,737 Virginia ........................... 66,994 72,966 -8.2 53,243 58,902 11,616 11,848 386 362 1,750 1,855 West Virginia .................. 79,080 80,789 -2.1 55,670 56,720 22,404 23,145 -- -- 1,006 924 East South Central ........ 387,888 387,204 .2 334,506 340,896 44,106 37,179 116 123 9,160 9,006 Alabama ......................... 157,169 152,151 3.3 119,417 122,766 33,324 25,166 -- -- 4,428 4,218 Kentucky ........................ 98,184 98,218 .0 97,509 97,472 130 171 -- -- 546 574 Mississippi ...................... 51,617 54,487 -5.3 39,195 40,841 10,573 11,779 23 22 1,826 1,845 Tennessee ....................... 80,918 82,349 -1.7 78,385 79,816 79 63 93 101 2,361 2,369 West South Central ....... 678,881 647,831 4.8 258,112 251,309 347,214 324,017 523 576 73,031 71,929 Arkansas ......................... 61,426 61,000 .7 44,796 47,108 14,672 11,952 NM 6 1,953 1,934 Louisiana ........................ 105,263 102,885 2.3 54,938 51,681 22,089 22,863 47 47 28,190 28,294 Oklahoma ....................... 75,148 72,251 4.0 58,933 57,421 15,307 13,927 30 26 879 876 Texas .............................. 437,043 411,695 6.2 99,445 95,099 295,146 275,274 442 497 42,010 40,824 Mountain ....................... 363,432 366,054 -.7 290,732 284,497 69,760 77,896 218 212 2,721 3,449 Arizona ........................... 108,295 111,751 -3.1 94,192 91,233 13,763 20,142 69 72 271 304 Colorado ......................... 51,392 50,721 1.3 40,961 39,584 10,341 11,072 NM 4 67 61 Idaho ............................... 15,968 12,025 32.8 12,080 8,589 3,363 2,830 -- -- 525 606 Montana .......................... 29,911 29,791 .4 8,720 6,271 21,188 23,417 -- -- NM 103 Nevada ............................ 32,352 35,146 -8.0 21,627 23,711 10,474 11,172 59 62 193 201 New Mexico ................... 38,380 36,252 5.9 32,466 30,848 5,840 5,329 68 73 NM * Utah ................................ 40,522 42,249 -4.1 38,140 39,522 1,577 1,526 NM * 804 1,201 Wyoming ........................ 46,613 48,119 -3.1 42,546 44,739 3,215 2,408 -- -- 853 973 Pacific Contiguous ........ 377,684 362,725 4.1 260,565 226,139 98,420 116,319 2,325 2,389 16,373 17,877 California ........................ 199,634 204,126 -2.2 105,436 96,940 77,280 88,876 2,228 2,300 14,690 16,010 Oregon ............................ 60,568 55,127 9.9 49,687 41,143 10,412 13,373 23 21 446 590 Washington ..................... 117,481 103,473 13.5 105,441 88,057 10,728 14,070 74 68 1,238 1,277 Pacific Noncontiguous .. 17,233 17,596 -2.1 12,417 12,621 3,791 3,911 586 547 439 516 Alaska ............................. 6,851 6,760 1.4 6,298 6,205 186 204 268 234 99 116 Hawaii ............................ 10,382 10,836 -4.2 6,119 6,416 3,605 3,707 318 313 340 400 U.S. Total ....................... 4,105,734 4,125,060 -.5 2,457,990 2,471,632 1,497,075 1,500,754 8,403 8,592 142,266 144,082 * = Value is less than half of the smallest unit of measure (e.g., for values with no decimals, the smallest unit is "1" then values under 0.5 are shown as "*".) NM = Not meaningful due to large relative standard error or excessive percentage change. Notes: • See Glossary for definitions. • Values for 2010 are final. Values for 2010 are preliminary. - See Technical Notes for a discussion of the sample design for the Form <strong>EIA</strong>-923. • Negative generation denotes that electric power consumed for plant use exceeds gross generation. • Totals may not equal sum of components because of independent rounding. • Percentage difference is calculated before rounding. Source: U.S. Energy Information Administration, Form <strong>EIA</strong>-923, "<strong>Power</strong> Plant Operations Report." 28
- Page 1 and 2: Electric Power Monthly February 201
- Page 3 and 4: The Electric Power Monthly (EPM) pr
- Page 5 and 6: Table Index Executive Summary .....
- Page 7 and 8: Table 3.4. Stocks of Coal by Coal R
- Page 9 and 10: Table A5.B. Relative Standard Error
- Page 11 and 12: Table ES1.A. Total Electric Power I
- Page 13 and 14: Table ES2.A. Summary Statistics: Re
- Page 15 and 16: Table ES3. New U.S. Electric Genera
- Page 17 and 18: Table ES3. New U.S. Electric Genera
- Page 19 and 20: Table ES3. New U.S. Electric Genera
- Page 21 and 22: Table ES3. New U.S. Electric Genera
- Page 23 and 24: Table ES3. New U.S. Electric Genera
- Page 25 and 26: Table ES3. New U.S. Electric Genera
- Page 27 and 28: Table ES4. Retired U.S. Electric Ge
- Page 29 and 30: Chapter 1. Net Generation U.S. Ener
- Page 31 and 32: Table 1.1.A. Net Generation by Othe
- Page 33 and 34: Table 1.3. Net Generation by Energy
- Page 35: Table 1.5. Net Generation by Energy
- Page 39 and 40: Table 1.7.B. Net Generation from Co
- Page 41 and 42: Table 1.8.B. Net Generation from Pe
- Page 43 and 44: Table 1.9.B. Net Generation from Pe
- Page 45 and 46: Table 1.10.B. Net Generation from N
- Page 47 and 48: Table 1.11.B. Net Generation from O
- Page 49 and 50: Table 1.12.B. Net Generation from N
- Page 51 and 52: Table 1.13.B. Net Generation from H
- Page 53 and 54: Table 1.14.B. Net Generation from O
- Page 55 and 56: Table 1.15.B. Net Generation from H
- Page 57 and 58: Table 1.16.B. Net Generation from O
- Page 59 and 60: Table 1.17.B. Net Generation from W
- Page 61 and 62: Table 1.18.B. Net Generation from B
- Page 63 and 64: Table 1.20.A. Net Generation from S
- Page 65 and 66: Table 2.1.A. Coal: Consumption for
- Page 67 and 68: Table 2.1.C. Coal: Consumption for
- Page 69 and 70: Table 2.2.B. Petroleum Liquids: Con
- Page 71 and 72: Table 2.3.A. Petroleum Coke: Consum
- Page 73 and 74: Table 2.3.C. Petroleum Coke: Consum
- Page 75 and 76: Table 2.4.B. Natural Gas: Consumpti
- Page 77 and 78: Table 2.5.A. Consumption of Coal fo
- Page 79 and 80: Table 2.6.A. Consumption of Petrole
- Page 81 and 82: Table 2.7.A. Consumption of Petrole
- Page 83 and 84: Table 2.8.A. Consumption of Natural
- Page 85 and 86: Chapter 3. Fossil-Fuel Stocks for E
- Page 87 and 88:
Table 3.2. Stocks of Coal, Petroleu
- Page 89 and 90:
Table 3.4. Stocks of Coal by Coal R
- Page 91 and 92:
Table 4.1. Receipts, Average Cost,
- Page 93 and 94:
Table 4.2. Receipts, Average Cost,
- Page 95 and 96:
Table 4.3. Receipts, Average Cost,
- Page 97 and 98:
Table 4.4. Receipts, Average Cost,
- Page 99 and 100:
Table 4.5. Receipts, Average Cost,
- Page 101 and 102:
Table 4.6.A. Receipts of Coal Deliv
- Page 103 and 104:
Table 4.7.A. Receipts of Petroleum
- Page 105 and 106:
Table 4.8.A. Receipts of Petroleum
- Page 107 and 108:
Table 4.9.A. Receipts of Natural Ga
- Page 109 and 110:
Table 4.10.A. Average Cost of Coal
- Page 111 and 112:
Table 4.11.A. Average Cost of Petro
- Page 113 and 114:
Table 4.12.A. Average Cost of Petro
- Page 115 and 116:
Table 4.13.A. Average Cost of Natur
- Page 117 and 118:
Table 4.14. Receipts and Quality of
- Page 119 and 120:
Table 4.16. Receipts and Quality of
- Page 121 and 122:
Table 4.18. Receipts and Quality of
- Page 123 and 124:
Table 5.1. Retail Sales of Electric
- Page 125 and 126:
Table 5.3. Average Retail Price of
- Page 127 and 128:
Table 5.4.B. Retail Sales of Electr
- Page 129 and 130:
Table 5.5.B. Revenue from Retail Sa
- Page 131 and 132:
Table 5.6.B. Average Retail Price o
- Page 133 and 134:
Appendix A Relative Standard Error
- Page 135 and 136:
Table A1.B. Relative Standard Error
- Page 137 and 138:
Table A2.A. Relative Standard Error
- Page 139 and 140:
Table A2.B. Relative Standard Error
- Page 141 and 142:
Table A3.A. Relative Standard Error
- Page 143 and 144:
Table A3.B. Relative Standard Error
- Page 145 and 146:
Table A4.A. Relative Standard Error
- Page 147 and 148:
Table A4.B. Relative Standard Error
- Page 149 and 150:
Table A5.A. Relative Standard Error
- Page 151 and 152:
Table A5.B. Relative Standard Error
- Page 153 and 154:
Table A6.A. Relative Standard Error
- Page 155 and 156:
Table A7.A. Relative Standard Error
- Page 157 and 158:
Table A8.A. Relative Standard Error
- Page 159 and 160:
Appendix B Major Disturbances and U
- Page 161 and 162:
05/25/11 Duke Energy Midwest(RFC) 1
- Page 163 and 164:
Table B.1. Major Disturbances and U
- Page 165 and 166:
Table B.2. Major Disturbances and U
- Page 167 and 168:
Table B.2. Major Disturbances and U
- Page 169 and 170:
The Energy Information Administrati
- Page 171 and 172:
Data Sources For Electric Power Mon
- Page 173 and 174:
ate charged by the electric utility
- Page 175 and 176:
data only on fossil-steam plants, b
- Page 177 and 178:
contents of the components of MSW w
- Page 179 and 180:
Construction 23 Manufacturing 311 F
- Page 181 and 182:
Table C2. Comparison of Preliminary
- Page 183 and 184:
Table C4. Unit-of-Measure Equivalen
- Page 185 and 186:
20 Knaub, J.R., Jr. (2003), “Appl
- Page 187 and 188:
such as briquettes, pellets, or ext
- Page 189 and 190:
order to provide, distribute, and s
- Page 191 and 192:
station(s) for station service or a
- Page 193:
concentrations of 1 percent or less