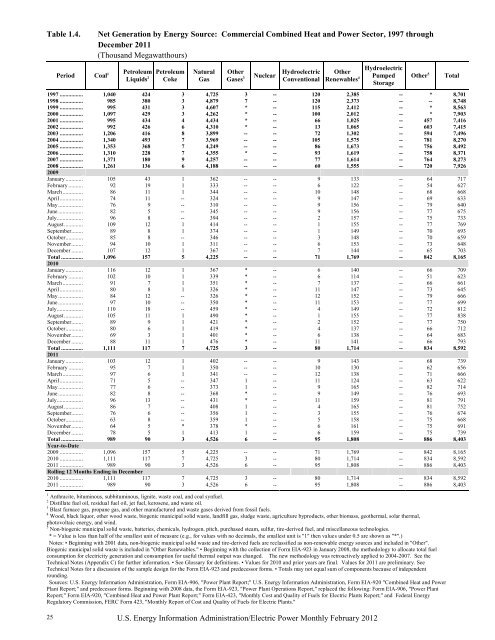
Table 1.4. Net Generation by Energy Source: Commercial Combined Heat and <strong>Power</strong> Sector, 1997 through December 2011 (Thousand Megawatthours) 25 Period Coal 1 Petroleum Liquids 2 Petroleum Coke Natural Gas Other Gases 3 Hydroelectric Nuclear Conventional Other Renewables 4 U.S. Energy Information Administration/<strong>Electric</strong> <strong>Power</strong> <strong>Monthly</strong> <strong>February</strong> <strong>2012</strong> Hydroelectric Pumped Storage Other 5 Total 1997 ................ 1,040 424 3 4,725 3 -- 120 2,385 -- * 8,701 1998 ................ 985 380 3 4,879 7 -- 120 2,373 -- -- 8,748 1999 ................ 995 431 3 4,607 * -- 115 2,412 -- * 8,563 2000 ................ 1,097 429 3 4,262 * -- 100 2,012 -- * 7,903 2001 ................ 995 434 4 4,434 * -- 66 1,025 -- 457 7,416 2002 ................ 992 426 6 4,310 * -- 13 1,065 -- 603 7,415 2003 ................ 1,206 416 8 3,899 -- -- 72 1,302 -- 594 7,496 2004 ................ 1,340 493 7 3,969 -- -- 105 1,575 -- 781 8,270 2005 ................ 1,353 368 7 4,249 -- -- 86 1,673 -- 756 8,492 2006 ................ 1,310 228 7 4,355 * -- 93 1,619 -- 758 8,371 2007 ................ 1,371 180 9 4,257 -- -- 77 1,614 -- 764 8,273 2008 ................ 1,261 136 6 4,188 -- -- 60 1,555 -- 720 7,926 2009 January ............ 105 43 1 362 -- -- 9 133 -- 64 717 <strong>February</strong> .......... 92 19 1 333 -- -- 6 122 -- 54 627 March .............. 86 11 1 344 -- -- 10 148 -- 68 668 April ................ 74 11 -- 324 -- -- 9 147 -- 69 633 May ................. 76 9 -- 310 -- -- 9 156 -- 79 640 June ................. 82 5 -- 345 -- -- 9 156 -- 77 675 July .................. 96 8 -- 394 -- -- 2 157 -- 75 733 August ............. 109 12 1 414 -- -- 1 155 -- 77 769 September........ 89 8 1 374 -- -- 1 149 -- 70 693 October ............ 85 8 -- 346 -- -- 3 148 -- 70 659 November ........ 94 10 1 311 -- -- 6 153 -- 73 648 December ........ 107 12 1 367 -- -- 7 144 -- 65 703 Total ............... 1,096 157 5 4,225 -- -- 71 1,769 -- 842 8,165 2010 January ............ 116 12 1 367 * -- 6 140 -- 66 709 <strong>February</strong> .......... 102 10 1 339 * -- 6 114 -- 51 623 March .............. 91 7 1 351 * -- 7 137 -- 66 661 April ................ 80 8 1 326 * -- 11 147 -- 73 645 May ................. 84 12 -- 326 * -- 12 152 -- 79 666 June ................. 97 10 -- 350 * -- 11 153 -- 77 699 July .................. 110 18 -- 459 * -- 4 149 -- 72 812 August ............. 105 11 1 490 * -- 1 155 -- 77 838 September........ 89 9 1 421 * -- 2 152 -- 77 750 October ............ 80 6 1 419 * -- 4 137 -- 66 712 November ........ 69 3 1 401 * -- 6 138 -- 64 683 December ........ 88 11 1 476 * -- 11 141 -- 66 793 Total ............... 1,111 117 7 4,725 3 -- 80 1,714 -- 834 8,592 2011 January ............ 103 12 1 402 -- -- 9 143 -- 68 739 <strong>February</strong> .......... 95 7 1 350 -- -- 10 130 -- 62 656 March .............. 97 6 1 341 -- -- 12 138 -- 71 666 April ................ 71 5 -- 347 1 -- 11 124 -- 63 622 May ................. 77 6 -- 373 1 -- 9 165 -- 82 714 June ................. 82 8 -- 368 * -- 9 149 -- 76 693 July .................. 96 13 -- 431 * -- 11 159 -- 81 791 August ............. 86 7 -- 408 1 -- 4 165 -- 81 752 September........ 76 6 -- 356 1 -- 3 155 -- 76 674 October ............ 63 8 -- 359 1 -- 5 158 -- 75 668 November ........ 64 5 * 378 * -- 6 161 -- 75 691 December ........ 78 5 1 413 1 -- 6 159 -- 75 739 Total ............... 989 90 3 4,526 6 -- 95 1,808 -- 886 8,403 Year-to-Date 2009 ................ 1,096 157 5 4,225 -- -- 71 1,769 -- 842 8,165 2010 ................ 1,111 117 7 4,725 3 -- 80 1,714 -- 834 8,592 2011 ................ 989 90 3 4,526 6 -- 95 1,808 -- 886 8,403 Rolling 12 Months Ending in December 2010 ................ 1,111 117 7 4,725 3 -- 80 1,714 -- 834 8,592 2011 ................ 989 90 3 4,526 6 -- 95 1,808 -- 886 8,403 1 Anthracite, bituminous, subbituminous, lignite, waste coal, and coal synfuel. 2 Distillate fuel oil, residual fuel oil, jet fuel, kerosene, and waste oil. 3 Blast furnace gas, propane gas, and other manufactured and waste gases derived from fossil fuels. 4 Wood, black liquor, other wood waste, biogenic municipal solid waste, landfill gas, sludge waste, agriculture byproducts, other biomass, geothermal, solar thermal, photovoltaic energy, and wind. 5 Non-biogenic municipal solid waste, batteries, chemicals, hydrogen, pitch, purchased steam, sulfur, tire-derived fuel, and miscellaneous technologies. * = Value is less than half of the smallest unit of measure (e.g., for values with no decimals, the smallest unit is "1" then values under 0.5 are shown as "*".) Notes: • Beginning with 2001 data, non-biogenic municipal solid waste and tire-derived fuels are reclassified as non-renewable energy sources and included in "Other". Biogenic municipal solid waste is included in "Other Renewables." • Beginning with the collection of Form <strong>EIA</strong>-923 in January 2008, the methodology to allocate total fuel consumption for electricity generation and consumption for useful thermal output was changed. The new methodology was retroactively applied to 2004-2007. See the Technical Notes (Appendix C) for further information. • See Glossary for definitions. • Values for 2010 and prior years are final. Values for 2011 are preliminary. See Technical Notes for a discussion of the sample design for the Form <strong>EIA</strong>-923 and predecessor forms. • Totals may not equal sum of components because of independent rounding. Sources: U.S. Energy Information Administration, Form <strong>EIA</strong>-906, "<strong>Power</strong> Plant Report;" U.S. Energy Information Administration, Form <strong>EIA</strong>-920 "Combined Heat and <strong>Power</strong> Plant Report;" and predecessor forms. Beginning with 2008 data, the Form <strong>EIA</strong>-923, "<strong>Power</strong> Plant Operations Report," replaced the following: Form <strong>EIA</strong>-906, "<strong>Power</strong> Plant Report;" Form <strong>EIA</strong>-920, "Combined Heat and <strong>Power</strong> Plant Report;" Form <strong>EIA</strong>-423, "<strong>Monthly</strong> Cost and Quality of Fuels for <strong>Electric</strong> Plants Report;" and Federal Energy Regulatory Commission, FERC Form 423, "<strong>Monthly</strong> Report of Cost and Quality of Fuels for <strong>Electric</strong> Plants."
Table 1.5. Net Generation by Energy Source: Industrial Combined Heat and <strong>Power</strong> Sector, 1997 through December 2011 (Thousand Megawatthours) Period Coal 1 Petroleum Liquids 2 Petroleum Coke Natural Gas Other Gases 3 Hydroelectric Nuclear Conventional Other Renewables 4 U.S. Energy Information Administration/<strong>Electric</strong> <strong>Power</strong> <strong>Monthly</strong> <strong>February</strong> <strong>2012</strong> Hydroelectric Pumped Storage Other 5 Total 1997 ................ 23,214 4,001 1,648 75,078 11,814 -- 5,685 29,107 -- 3,549 154,097 1998 ................ 22,337 4,514 1,692 77,085 11,170 -- 5,349 28,572 -- 3,412 154,132 1999 ................ 21,474 4,229 1,860 78,793 12,519 -- 4,758 28,747 -- 3,885 156,264 2000 ................ 22,056 4,149 1,448 78,798 11,927 -- 4,135 29,491 -- 4,669 156,673 2001 ................ 20,135 3,952 1,341 79,755 8,454 -- 3,145 27,485 -- 4,908 149,175 2002 ................ 21,525 3,196 1,207 79,013 9,493 -- 3,825 30,489 -- 3,832 152,580 2003 ................ 19,817 3,726 1,559 78,705 12,953 -- 4,222 28,704 -- 4,843 154,530 2004 ................ 19,773 4,128 1,839 78,959 11,684 -- 3,248 29,164 -- 5,129 153,925 2005 ................ 19,466 3,804 1,564 72,882 9,687 -- 3,195 29,003 -- 5,137 144,739 2006 ................ 19,464 2,567 1,656 77,669 9,923 -- 2,899 28,972 -- 5,103 148,254 2007 ................ 16,694 2,355 1,889 77,580 9,411 -- 1,590 28,919 -- 4,690 143,128 2008 ................ 15,703 1,555 1,664 76,421 8,507 -- 1,676 27,462 -- 4,125 137,113 2009 January ............ 1,194 204 119 6,059 587 -- 165 2,114 -- 316 10,760 <strong>February</strong> .......... 1,081 174 125 5,642 571 -- 144 1,978 -- 325 10,040 March .............. 1,130 152 109 6,022 595 -- 193 2,119 -- 358 10,678 April ................ 1,058 135 103 5,534 527 -- 191 2,005 -- 357 9,910 May ................. 1,070 128 107 5,710 539 -- 187 2,029 -- 401 10,170 June ................. 1,160 130 114 6,269 623 -- 169 2,114 -- 394 10,973 July .................. 1,195 96 143 7,013 678 -- 140 2,305 -- 400 11,968 August ............. 1,235 99 140 7,189 734 -- 136 2,387 -- 393 12,314 September........ 1,105 96 142 6,810 725 -- 95 2,220 -- 352 11,545 October ............ 1,204 80 132 6,405 680 -- 136 2,278 -- 375 11,289 November ........ 1,072 79 136 6,239 655 -- 137 2,257 -- 400 10,975 December ........ 1,181 99 120 6,855 662 -- 175 2,229 -- 387 11,709 Total ............... 13,686 1,474 1,489 75,748 7,574 -- 1,868 26,033 -- 4,457 132,329 2010 January ............ 1,544 102 123 6,959 634 -- 169 2,185 -- 404 12,120 <strong>February</strong> .......... 1,481 86 111 6,303 578 -- 162 2,031 -- 366 11,118 March .............. 1,649 63 100 6,588 735 -- 188 2,217 -- 397 11,936 April ................ 1,258 61 108 6,194 669 -- 187 2,174 -- 382 11,034 May ................. 1,519 63 118 6,477 738 -- 164 2,130 -- 406 11,614 June ................. 1,482 55 132 6,885 700 -- 132 2,205 -- 485 12,075 July .................. 1,713 67 128 7,205 696 -- 107 2,321 -- 482 12,718 August ............. 1,792 55 133 7,701 812 -- 99 2,321 -- 482 13,395 September........ 1,499 58 107 7,085 713 -- 76 2,244 -- 455 12,238 October ............ 1,527 71 113 6,443 637 -- 117 2,199 -- 455 11,562 November ........ 1,301 72 124 6,520 688 -- 130 2,224 -- 436 11,493 December ........ 1,677 92 118 7,223 744 -- 134 2,326 -- 464 12,777 Total ............... 18,441 844 1,414 81,583 8,343 -- 1,668 26,576 -- 5,214 144,082 2011 January ............ 1,723 67 131 7,017 663 -- 137 2,342 -- 259 12,341 <strong>February</strong> .......... 1,447 52 100 6,314 564 -- 160 2,086 -- 238 10,961 March .............. 1,457 52 113 6,478 705 -- 188 2,222 -- 280 11,494 April ................ 1,155 62 100 6,473 662 -- 196 2,175 -- 265 11,089 May ................. 1,622 39 100 6,829 597 -- 208 2,123 -- 304 11,822 June ................. 1,549 53 102 6,696 698 -- 147 2,394 -- 282 11,921 July .................. 1,763 42 117 7,181 762 -- 118 2,382 -- 305 12,669 August ............. 1,814 46 111 7,248 706 -- 100 2,347 -- 268 12,639 September........ 1,686 68 98 6,629 670 -- 123 2,293 -- 245 11,811 October ............ 1,609 44 91 6,312 669 -- 126 2,198 -- 268 11,317 November ........ 1,266 36 85 6,841 680 -- 147 2,304 -- 263 11,623 December ........ 1,317 45 93 7,480 738 -- 188 2,433 -- 283 12,577 Total ............... 18,406 604 1,242 81,500 8,115 -- 1,838 27,300 -- 3,261 142,266 Year-to-Date 2009 ................ 13,686 1,474 1,489 75,748 7,574 -- 1,868 26,033 -- 4,457 132,329 2010 ................ 18,441 844 1,414 81,583 8,343 -- 1,668 26,576 -- 5,214 144,082 2011 ................ 18,406 604 1,242 81,500 8,115 -- 1,838 27,300 -- 3,261 142,266 Rolling 12 Months Ending in December 2010 ................ 18,441 844 1,414 81,583 8,343 -- 1,668 26,576 -- 5,214 144,082 2011 ................ 18,406 604 1,242 81,500 8,115 -- 1,838 27,300 -- 3,261 142,266 1 Anthracite, bituminous, subbituminous, lignite, waste coal, and coal synfuel. 2 Distillate fuel oil, residual fuel oil, jet fuel, kerosene, and waste oil. 3 Blast furnace gas, propane gas, and other manufactured and waste gases derived from fossil fuels. 4 Wood, black liquor, other wood waste, biogenic municipal solid waste, landfill gas, sludge waste, agriculture byproducts, other biomass, geothermal, solar thermal, photovoltaic energy, and wind. 5 Non-biogenic municipal solid waste, batteries, chemicals, hydrogen, pitch, purchased steam, sulfur, tire-derived fuel, and miscellaneous technologies. Notes: • Beginning with 2001 data, non-biogenic municipal solid waste and tire-derived fuels are reclassified as non-renewable energy sources and included in "Other". Biogenic municipal solid waste is included in "Other Renewables." • Beginning with the collection of Form <strong>EIA</strong>-923 in January 2008, the methodology to allocate total fuel consumption for electricity generation and consumption for useful thermal output was changed. The new methodology was retroactively applied to 2004-2007. See the Technical Notes (Appendix C) for further information. • See Glossary for definitions. • Values for 2010 and prior years are final. Values for 2011 are preliminary. See Technical Notes for a discussion of the sample design for the Form <strong>EIA</strong>-923 and predecessor forms. • Totals may not equal sum of components because of independent rounding. Sources: U.S. Energy Information Administration, Form <strong>EIA</strong>-906, "<strong>Power</strong> Plant Report;" U.S. Energy Information Administration, Form <strong>EIA</strong>-920 "Combined Heat and <strong>Power</strong> Plant Report;" and predecessor forms. Beginning with 2008 data, the Form <strong>EIA</strong>-923, "<strong>Power</strong> Plant Operations Report," replaced the following: Form <strong>EIA</strong>-906, "<strong>Power</strong> Plant Report;" Form <strong>EIA</strong>-920, "Combined Heat and <strong>Power</strong> Plant Report;" Form <strong>EIA</strong>-423, "<strong>Monthly</strong> Cost and Quality of Fuels for <strong>Electric</strong> Plants Report;" and Federal Energy Regulatory Commission, FERC Form 423, "<strong>Monthly</strong> Report of Cost and Quality of Fuels for <strong>Electric</strong> Plants." 26
- Page 1 and 2: Electric Power Monthly February 201
- Page 3 and 4: The Electric Power Monthly (EPM) pr
- Page 5 and 6: Table Index Executive Summary .....
- Page 7 and 8: Table 3.4. Stocks of Coal by Coal R
- Page 9 and 10: Table A5.B. Relative Standard Error
- Page 11 and 12: Table ES1.A. Total Electric Power I
- Page 13 and 14: Table ES2.A. Summary Statistics: Re
- Page 15 and 16: Table ES3. New U.S. Electric Genera
- Page 17 and 18: Table ES3. New U.S. Electric Genera
- Page 19 and 20: Table ES3. New U.S. Electric Genera
- Page 21 and 22: Table ES3. New U.S. Electric Genera
- Page 23 and 24: Table ES3. New U.S. Electric Genera
- Page 25 and 26: Table ES3. New U.S. Electric Genera
- Page 27 and 28: Table ES4. Retired U.S. Electric Ge
- Page 29 and 30: Chapter 1. Net Generation U.S. Ener
- Page 31 and 32: Table 1.1.A. Net Generation by Othe
- Page 33: Table 1.3. Net Generation by Energy
- Page 37 and 38: Table 1.6.B. Net Generation by Stat
- Page 39 and 40: Table 1.7.B. Net Generation from Co
- Page 41 and 42: Table 1.8.B. Net Generation from Pe
- Page 43 and 44: Table 1.9.B. Net Generation from Pe
- Page 45 and 46: Table 1.10.B. Net Generation from N
- Page 47 and 48: Table 1.11.B. Net Generation from O
- Page 49 and 50: Table 1.12.B. Net Generation from N
- Page 51 and 52: Table 1.13.B. Net Generation from H
- Page 53 and 54: Table 1.14.B. Net Generation from O
- Page 55 and 56: Table 1.15.B. Net Generation from H
- Page 57 and 58: Table 1.16.B. Net Generation from O
- Page 59 and 60: Table 1.17.B. Net Generation from W
- Page 61 and 62: Table 1.18.B. Net Generation from B
- Page 63 and 64: Table 1.20.A. Net Generation from S
- Page 65 and 66: Table 2.1.A. Coal: Consumption for
- Page 67 and 68: Table 2.1.C. Coal: Consumption for
- Page 69 and 70: Table 2.2.B. Petroleum Liquids: Con
- Page 71 and 72: Table 2.3.A. Petroleum Coke: Consum
- Page 73 and 74: Table 2.3.C. Petroleum Coke: Consum
- Page 75 and 76: Table 2.4.B. Natural Gas: Consumpti
- Page 77 and 78: Table 2.5.A. Consumption of Coal fo
- Page 79 and 80: Table 2.6.A. Consumption of Petrole
- Page 81 and 82: Table 2.7.A. Consumption of Petrole
- Page 83 and 84: Table 2.8.A. Consumption of Natural
- Page 85 and 86:
Chapter 3. Fossil-Fuel Stocks for E
- Page 87 and 88:
Table 3.2. Stocks of Coal, Petroleu
- Page 89 and 90:
Table 3.4. Stocks of Coal by Coal R
- Page 91 and 92:
Table 4.1. Receipts, Average Cost,
- Page 93 and 94:
Table 4.2. Receipts, Average Cost,
- Page 95 and 96:
Table 4.3. Receipts, Average Cost,
- Page 97 and 98:
Table 4.4. Receipts, Average Cost,
- Page 99 and 100:
Table 4.5. Receipts, Average Cost,
- Page 101 and 102:
Table 4.6.A. Receipts of Coal Deliv
- Page 103 and 104:
Table 4.7.A. Receipts of Petroleum
- Page 105 and 106:
Table 4.8.A. Receipts of Petroleum
- Page 107 and 108:
Table 4.9.A. Receipts of Natural Ga
- Page 109 and 110:
Table 4.10.A. Average Cost of Coal
- Page 111 and 112:
Table 4.11.A. Average Cost of Petro
- Page 113 and 114:
Table 4.12.A. Average Cost of Petro
- Page 115 and 116:
Table 4.13.A. Average Cost of Natur
- Page 117 and 118:
Table 4.14. Receipts and Quality of
- Page 119 and 120:
Table 4.16. Receipts and Quality of
- Page 121 and 122:
Table 4.18. Receipts and Quality of
- Page 123 and 124:
Table 5.1. Retail Sales of Electric
- Page 125 and 126:
Table 5.3. Average Retail Price of
- Page 127 and 128:
Table 5.4.B. Retail Sales of Electr
- Page 129 and 130:
Table 5.5.B. Revenue from Retail Sa
- Page 131 and 132:
Table 5.6.B. Average Retail Price o
- Page 133 and 134:
Appendix A Relative Standard Error
- Page 135 and 136:
Table A1.B. Relative Standard Error
- Page 137 and 138:
Table A2.A. Relative Standard Error
- Page 139 and 140:
Table A2.B. Relative Standard Error
- Page 141 and 142:
Table A3.A. Relative Standard Error
- Page 143 and 144:
Table A3.B. Relative Standard Error
- Page 145 and 146:
Table A4.A. Relative Standard Error
- Page 147 and 148:
Table A4.B. Relative Standard Error
- Page 149 and 150:
Table A5.A. Relative Standard Error
- Page 151 and 152:
Table A5.B. Relative Standard Error
- Page 153 and 154:
Table A6.A. Relative Standard Error
- Page 155 and 156:
Table A7.A. Relative Standard Error
- Page 157 and 158:
Table A8.A. Relative Standard Error
- Page 159 and 160:
Appendix B Major Disturbances and U
- Page 161 and 162:
05/25/11 Duke Energy Midwest(RFC) 1
- Page 163 and 164:
Table B.1. Major Disturbances and U
- Page 165 and 166:
Table B.2. Major Disturbances and U
- Page 167 and 168:
Table B.2. Major Disturbances and U
- Page 169 and 170:
The Energy Information Administrati
- Page 171 and 172:
Data Sources For Electric Power Mon
- Page 173 and 174:
ate charged by the electric utility
- Page 175 and 176:
data only on fossil-steam plants, b
- Page 177 and 178:
contents of the components of MSW w
- Page 179 and 180:
Construction 23 Manufacturing 311 F
- Page 181 and 182:
Table C2. Comparison of Preliminary
- Page 183 and 184:
Table C4. Unit-of-Measure Equivalen
- Page 185 and 186:
20 Knaub, J.R., Jr. (2003), “Appl
- Page 187 and 188:
such as briquettes, pellets, or ext
- Page 189 and 190:
order to provide, distribute, and s
- Page 191 and 192:
station(s) for station service or a
- Page 193:
concentrations of 1 percent or less