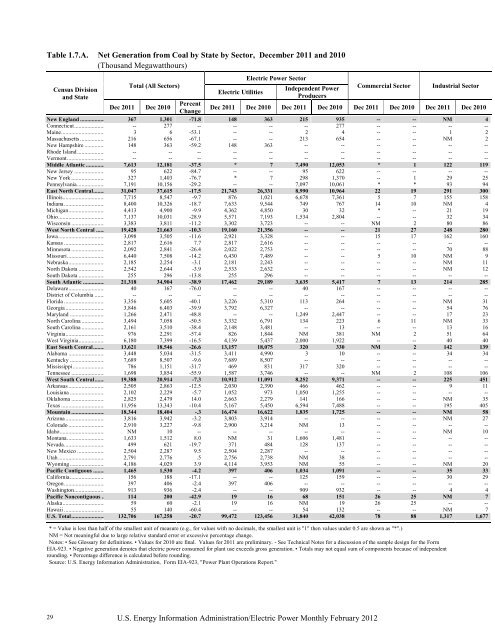
Table 1.7.A. Net Generation from Coal by State by Sector, December 2011 and 2010 (Thousand Megawatthours) 29 Census Division and State Total (All Sectors) <strong>Electric</strong> Utilities <strong>Electric</strong> <strong>Power</strong> Sector Independent <strong>Power</strong> Producers U.S. Energy Information Administration/<strong>Electric</strong> <strong>Power</strong> <strong>Monthly</strong> <strong>February</strong> <strong>2012</strong> Commercial Sector Industrial Sector Dec 2011 Dec 2010 Percent Change Dec 2011 Dec 2010 Dec 2011 Dec 2010 Dec 2011 Dec 2010 Dec 2011 Dec 2010 New England ................. 367 1,301 -71.8 148 363 215 935 -- -- NM 4 Connecticut ..................... -- 277 -- -- -- -- 277 -- -- -- -- Maine .............................. 3 6 -53.1 -- -- 2 4 -- -- 1 2 Massachusetts ................. 216 656 -67.1 -- -- 213 654 -- -- NM 2 New Hampshire .............. 148 363 -59.2 148 363 -- -- -- -- -- -- Rhode Island ................... -- -- -- -- -- -- -- -- -- -- -- Vermont .......................... -- -- -- -- -- -- -- -- -- -- -- Middle Atlantic ............. 7,613 12,181 -37.5 * 7 7,490 12,053 * 1 122 119 New Jersey ..................... 95 622 -84.7 -- -- 95 622 -- -- -- -- New York ....................... 327 1,403 -76.7 * 7 298 1,370 -- 1 29 25 Pennsylvania ................... 7,191 10,156 -29.2 -- -- 7,097 10,061 * * 93 94 East North Central........ 31,047 37,615 -17.5 21,743 26,331 8,990 10,964 22 19 291 300 Illinois............................. 7,715 8,547 -9.7 876 1,021 6,678 7,361 5 7 155 158 Indiana ............................ 8,400 10,326 -18.7 7,633 9,544 749 767 14 10 NM 4 Michigan ......................... 4,413 4,900 -9.9 4,362 4,850 30 32 * -- 21 19 Ohio ................................ 7,137 10,031 -28.9 5,571 7,193 1,534 2,804 -- -- 32 34 Wisconsin ....................... 3,383 3,811 -11.2 3,302 3,723 -- -- NM 2 80 86 West North Central ...... 19,428 21,663 -10.3 19,160 21,356 -- -- 21 27 248 280 Iowa ................................ 3,098 3,505 -11.6 2,921 3,328 -- -- 15 17 162 160 Kansas ............................ 2,817 2,616 7.7 2,817 2,616 -- -- -- -- -- -- Minnesota ....................... 2,092 2,841 -26.4 2,022 2,753 -- -- -- -- 70 88 Missouri .......................... 6,440 7,508 -14.2 6,430 7,489 -- -- 5 10 NM 9 Nebraska ......................... 2,185 2,254 -3.1 2,181 2,243 -- -- -- -- NM 11 North Dakota .................. 2,542 2,644 -3.9 2,533 2,632 -- -- -- -- NM 12 South Dakota .................. 255 296 -13.8 255 296 -- -- -- -- -- -- South Atlantic ............... 21,318 34,904 -38.9 17,462 29,189 3,635 5,417 7 13 214 285 Delaware ......................... 40 167 -76.0 -- -- 40 167 -- -- -- -- District of Columbia ....... -- -- -- -- -- -- -- -- -- -- -- Florida ............................ 3,356 5,605 -40.1 3,226 5,310 113 264 -- -- NM 31 Georgia ........................... 3,846 6,403 -39.9 3,792 6,327 -- -- -- -- 54 76 Maryland ........................ 1,266 2,471 -48.8 -- -- 1,249 2,447 -- -- 17 23 North Carolina ................ 3,494 7,058 -50.5 3,332 6,791 134 223 6 11 NM 33 South Carolina ................ 2,161 3,510 -38.4 2,148 3,481 -- 13 -- -- 13 16 Virginia ........................... 976 2,291 -57.4 826 1,844 NM 381 NM 2 51 64 West Virginia .................. 6,180 7,399 -16.5 4,139 5,437 2,000 1,922 -- -- 40 40 East South Central ........ 13,621 18,546 -26.6 13,157 18,075 320 330 NM 2 142 139 Alabama ......................... 3,448 5,034 -31.5 3,411 4,990 3 10 -- -- 34 34 Kentucky ........................ 7,689 8,507 -9.6 7,689 8,507 -- -- -- -- -- -- Mississippi ...................... 786 1,151 -31.7 469 831 317 320 -- -- -- -- Tennessee ....................... 1,698 3,854 -55.9 1,587 3,746 -- -- NM 2 108 106 West South Central ....... 19,388 20,914 -7.3 10,912 11,091 8,252 9,371 -- -- 225 451 Arkansas ......................... 2,505 2,863 -12.5 2,030 2,390 466 462 -- -- 9 11 Louisiana ........................ 2,102 2,229 -5.7 1,052 973 1,050 1,255 -- -- -- -- Oklahoma ....................... 2,825 2,479 14.0 2,663 2,279 141 166 -- -- NM 35 Texas .............................. 11,956 13,343 -10.4 5,167 5,450 6,594 7,488 -- -- 195 405 Mountain ....................... 18,344 18,404 -.3 16,474 16,622 1,835 1,725 -- -- NM 58 Arizona ........................... 3,816 3,942 -3.2 3,803 3,914 -- -- -- -- NM 27 Colorado ......................... 2,910 3,227 -9.8 2,900 3,214 NM 13 -- -- -- -- Idaho ............................... NM 10 -- -- -- -- -- -- -- NM 10 Montana .......................... 1,633 1,512 8.0 NM 31 1,606 1,481 -- -- -- -- Nevada ............................ 499 621 -19.7 371 484 128 137 -- -- -- -- New Mexico ................... 2,504 2,287 9.5 2,504 2,287 -- -- -- -- -- -- Utah ................................ 2,791 2,776 .5 2,756 2,738 NM 38 -- -- -- -- Wyoming ........................ 4,186 4,029 3.9 4,114 3,953 NM 55 -- -- NM 20 Pacific Contiguous ........ 1,465 1,530 -4.2 397 406 1,034 1,091 -- -- 35 33 California ........................ 156 188 -17.1 -- -- 125 159 -- -- 30 29 Oregon ............................ 397 406 -2.4 397 406 -- -- -- -- -- -- Washington ..................... 913 936 -2.4 -- -- 909 932 -- -- 4 4 Pacific Noncontiguous .. 114 200 -42.9 19 16 68 151 26 25 NM 7 Alaska ............................. 59 60 -2.1 19 16 NM 19 26 25 -- -- Hawaii ............................ 55 140 -60.4 -- -- 54 132 -- -- NM 7 U.S. Total ....................... 132,706 167,258 -20.7 99,472 123,456 31,840 42,038 78 88 1,317 1,677 * = Value is less than half of the smallest unit of measure (e.g., for values with no decimals, the smallest unit is "1" then values under 0.5 are shown as "*".) NM = Not meaningful due to large relative standard error or excessive percentage change. Notes: • See Glossary for definitions. • Values for 2010 are final. Values for 2011 are preliminary. - See Technical Notes for a discussion of the sample design for the Form <strong>EIA</strong>-923. • Negative generation denotes that electric power consumed for plant use exceeds gross generation. • Totals may not equal sum of components because of independent rounding. • Percentage difference is calculated before rounding. Source: U.S. Energy Information Administration, Form <strong>EIA</strong>-923, "<strong>Power</strong> Plant Operations Report."
Table 1.7.B. Net Generation from Coal by State by Sector, Year-to-Date through December 2011 and 2010 (Thousand Megawatthours) Census Division and State Total (All Sectors) <strong>Electric</strong> Utilities <strong>Electric</strong> <strong>Power</strong> Sector Independent <strong>Power</strong> Producers U.S. Energy Information Administration/<strong>Electric</strong> <strong>Power</strong> <strong>Monthly</strong> <strong>February</strong> <strong>2012</strong> Commercial Sector Industrial Sector 2011 2010 Percent Change 2011 2010 2011 2010 2011 2010 2011 2010 New England ................. 7,169 14,080 -49.1 2,213 3,083 4,908 10,937 -- -- 47 60 Connecticut ..................... 521 2,604 -80.0 -- -- 521 2,604 -- -- -- -- Maine .............................. 55 87 -37.5 -- -- 38 56 -- -- 17 31 Massachusetts ................. 4,380 8,306 -47.3 -- -- 4,350 8,277 -- -- 30 29 New Hampshire .............. 2,213 3,083 -28.2 2,213 3,083 -- -- -- -- -- -- Rhode Island ................... -- -- -- -- -- -- -- -- -- -- -- Vermont .......................... -- -- -- -- -- -- -- -- -- -- -- Middle Atlantic ............. 114,803 130,370 -11.9 NM 37 113,224 128,913 2 4 1,514 1,416 New Jersey ..................... 4,235 6,418 -34.0 -- -- 4,235 6,418 -- -- -- -- New York ....................... 10,026 13,583 -26.2 NM 37 9,600 13,175 1 2 363 369 Pennsylvania ................... 100,541 110,369 -8.9 -- -- 99,389 109,320 NM 2 1,152 1,047 East North Central........ 398,611 429,540 -7.2 285,652 308,939 109,196 116,714 399 458 3,365 3,429 Illinois............................. 89,831 93,611 -4.0 11,113 11,854 76,812 79,858 34 47 1,871 1,851 Indiana ............................ 104,167 112,328 -7.3 95,420 103,205 8,562 8,928 141 150 43 44 Michigan ......................... 58,818 65,604 -10.3 58,048 64,767 349 371 202 235 219 232 Ohio ................................ 105,623 117,828 -10.4 81,843 89,928 23,472 27,557 -- -- 308 344 Wisconsin ....................... 40,172 40,169 .0 39,228 39,186 -- -- 21 25 923 958 West North Central ...... 231,022 232,041 -.4 227,805 228,740 -- -- 232 305 2,985 2,996 Iowa ................................ 38,358 41,283 -7.1 36,273 39,368 -- -- 145 195 1,940 1,720 Kansas ............................ 31,656 32,505 -2.6 31,656 32,505 -- -- -- -- -- -- Minnesota ....................... 28,360 28,083 1.0 27,511 27,176 -- -- -- -- 849 906 Missouri .......................... 78,342 75,047 4.4 78,197 74,829 -- -- 87 109 58 109 Nebraska ......................... 24,655 23,363 5.5 24,616 23,215 -- -- -- -- 39 148 North Dakota .................. 27,065 28,462 -4.9 26,966 28,349 -- -- -- -- 99 113 South Dakota .................. 2,586 3,298 -21.6 2,586 3,298 -- -- -- -- -- -- South Atlantic ............... 325,676 372,661 -12.6 272,273 312,646 50,541 56,931 73 91 2,789 2,993 Delaware ......................... 1,457 2,568 -43.3 -- -- 1,457 2,568 -- -- -- -- District of Columbia ....... -- -- -- -- -- -- -- -- -- -- -- Florida ............................ 52,506 59,897 -12.3 49,494 56,074 2,727 3,465 -- -- 286 358 Georgia ........................... 60,171 73,298 -17.9 59,453 72,550 -- -- -- -- 718 748 Maryland ........................ 21,187 23,668 -10.5 -- -- 20,988 23,435 -- -- 199 233 North Carolina ................ 59,943 71,951 -16.7 57,242 69,274 2,295 2,242 51 65 356 370 South Carolina ................ 34,178 37,671 -9.3 33,927 37,340 74 126 -- -- 177 205 Virginia ........................... 20,207 25,459 -20.6 17,191 21,366 2,350 3,366 NM 26 645 702 West Virginia .................. 76,027 78,148 -2.7 54,967 56,041 20,652 21,730 -- -- 409 377 East South Central ........ 199,103 211,403 -5.8 194,767 206,125 2,557 3,432 21 27 1,758 1,819 Alabama ......................... 57,056 63,050 -9.5 56,530 62,502 81 113 -- -- 445 435 Kentucky ........................ 91,571 91,054 .6 91,571 91,054 -- -- -- -- -- -- Mississippi ...................... 9,730 13,629 -28.6 7,255 10,310 2,476 3,319 -- -- -- -- Tennessee ....................... 40,746 43,670 -6.7 39,412 42,260 -- -- 21 27 1,313 1,384 West South Central ....... 246,432 233,724 5.4 133,827 129,924 108,069 99,956 -- -- 4,536 3,845 Arkansas ......................... 29,418 28,152 4.5 25,158 26,422 4,159 1,619 -- -- 101 111 Louisiana ........................ 24,609 23,924 2.9 11,860 11,226 12,749 12,697 -- -- -- -- Oklahoma ....................... 34,517 31,475 9.7 32,204 29,103 1,882 1,962 -- -- 431 410 Texas .............................. 157,888 150,173 5.1 64,604 63,173 89,280 83,677 -- -- 4,004 3,323 Mountain ....................... 198,745 206,551 -3.8 180,266 184,218 17,495 20,888 -- -- 984 1,445 Arizona ........................... 43,678 43,644 .1 43,414 43,348 -- -- -- -- 264 296 Colorado ......................... 34,169 34,559 -1.1 34,002 34,387 167 172 -- -- -- -- Idaho ............................... 78 88 -11.5 -- -- -- -- -- -- 78 88 Montana .......................... 15,307 18,601 -17.7 297 315 15,011 18,286 -- -- -- -- Nevada ............................ 5,391 6,997 -23.0 4,076 5,584 1,315 1,413 -- -- -- -- New Mexico ................... 27,141 25,618 5.9 27,141 25,618 -- -- -- -- -- -- Utah ................................ 33,067 34,057 -2.9 32,232 32,840 394 378 -- -- 441 840 Wyoming ........................ 39,914 42,987 -7.1 39,105 42,127 609 639 -- -- 201 221 Pacific Contiguous ........ 10,664 14,754 -27.7 3,334 4,126 6,940 10,238 -- -- 391 389 California ........................ 2,102 2,100 .1 -- -- 1,740 1,751 -- -- 363 349 Oregon ............................ 3,334 4,126 -19.2 3,334 4,126 -- -- -- -- -- -- Washington ..................... 5,229 8,527 -38.7 -- -- 5,200 8,487 -- -- 29 40 Pacific Noncontiguous .. 2,040 2,166 -5.8 178 189 1,563 1,700 262 227 37 49 Alaska ............................. 626 620 .8 178 189 186 204 262 227 -- -- Hawaii ............................ 1,414 1,546 -8.5 -- -- 1,377 1,496 -- -- 37 49 U.S. Total ....................... 1,734,265 1,847,290 -6.1 1,300,377 1,378,028 414,493 449,709 989 1,111 18,406 18,441 NM = Not meaningful due to large relative standard error or excessive percentage change. Notes: • See Glossary for definitions. • Values for 2010 are final. Values for 2011 are preliminary. - See Technical Notes for a discussion of the sample design for the Form <strong>EIA</strong>-923. • Negative generation denotes that electric power consumed for plant use exceeds gross generation. • Totals may not equal sum of components because of independent rounding. • Percentage difference is calculated before rounding. • Coal includes anthracite, bituminous coal, subbituminous coal, lignite, waste coal, and coal synfuel. Source: U.S. Energy Information Administration, Form <strong>EIA</strong>-923, "<strong>Power</strong> Plant Operations Report." 30
- Page 1 and 2: Electric Power Monthly February 201
- Page 3 and 4: The Electric Power Monthly (EPM) pr
- Page 5 and 6: Table Index Executive Summary .....
- Page 7 and 8: Table 3.4. Stocks of Coal by Coal R
- Page 9 and 10: Table A5.B. Relative Standard Error
- Page 11 and 12: Table ES1.A. Total Electric Power I
- Page 13 and 14: Table ES2.A. Summary Statistics: Re
- Page 15 and 16: Table ES3. New U.S. Electric Genera
- Page 17 and 18: Table ES3. New U.S. Electric Genera
- Page 19 and 20: Table ES3. New U.S. Electric Genera
- Page 21 and 22: Table ES3. New U.S. Electric Genera
- Page 23 and 24: Table ES3. New U.S. Electric Genera
- Page 25 and 26: Table ES3. New U.S. Electric Genera
- Page 27 and 28: Table ES4. Retired U.S. Electric Ge
- Page 29 and 30: Chapter 1. Net Generation U.S. Ener
- Page 31 and 32: Table 1.1.A. Net Generation by Othe
- Page 33 and 34: Table 1.3. Net Generation by Energy
- Page 35 and 36: Table 1.5. Net Generation by Energy
- Page 37: Table 1.6.B. Net Generation by Stat
- Page 41 and 42: Table 1.8.B. Net Generation from Pe
- Page 43 and 44: Table 1.9.B. Net Generation from Pe
- Page 45 and 46: Table 1.10.B. Net Generation from N
- Page 47 and 48: Table 1.11.B. Net Generation from O
- Page 49 and 50: Table 1.12.B. Net Generation from N
- Page 51 and 52: Table 1.13.B. Net Generation from H
- Page 53 and 54: Table 1.14.B. Net Generation from O
- Page 55 and 56: Table 1.15.B. Net Generation from H
- Page 57 and 58: Table 1.16.B. Net Generation from O
- Page 59 and 60: Table 1.17.B. Net Generation from W
- Page 61 and 62: Table 1.18.B. Net Generation from B
- Page 63 and 64: Table 1.20.A. Net Generation from S
- Page 65 and 66: Table 2.1.A. Coal: Consumption for
- Page 67 and 68: Table 2.1.C. Coal: Consumption for
- Page 69 and 70: Table 2.2.B. Petroleum Liquids: Con
- Page 71 and 72: Table 2.3.A. Petroleum Coke: Consum
- Page 73 and 74: Table 2.3.C. Petroleum Coke: Consum
- Page 75 and 76: Table 2.4.B. Natural Gas: Consumpti
- Page 77 and 78: Table 2.5.A. Consumption of Coal fo
- Page 79 and 80: Table 2.6.A. Consumption of Petrole
- Page 81 and 82: Table 2.7.A. Consumption of Petrole
- Page 83 and 84: Table 2.8.A. Consumption of Natural
- Page 85 and 86: Chapter 3. Fossil-Fuel Stocks for E
- Page 87 and 88: Table 3.2. Stocks of Coal, Petroleu
- Page 89 and 90:
Table 3.4. Stocks of Coal by Coal R
- Page 91 and 92:
Table 4.1. Receipts, Average Cost,
- Page 93 and 94:
Table 4.2. Receipts, Average Cost,
- Page 95 and 96:
Table 4.3. Receipts, Average Cost,
- Page 97 and 98:
Table 4.4. Receipts, Average Cost,
- Page 99 and 100:
Table 4.5. Receipts, Average Cost,
- Page 101 and 102:
Table 4.6.A. Receipts of Coal Deliv
- Page 103 and 104:
Table 4.7.A. Receipts of Petroleum
- Page 105 and 106:
Table 4.8.A. Receipts of Petroleum
- Page 107 and 108:
Table 4.9.A. Receipts of Natural Ga
- Page 109 and 110:
Table 4.10.A. Average Cost of Coal
- Page 111 and 112:
Table 4.11.A. Average Cost of Petro
- Page 113 and 114:
Table 4.12.A. Average Cost of Petro
- Page 115 and 116:
Table 4.13.A. Average Cost of Natur
- Page 117 and 118:
Table 4.14. Receipts and Quality of
- Page 119 and 120:
Table 4.16. Receipts and Quality of
- Page 121 and 122:
Table 4.18. Receipts and Quality of
- Page 123 and 124:
Table 5.1. Retail Sales of Electric
- Page 125 and 126:
Table 5.3. Average Retail Price of
- Page 127 and 128:
Table 5.4.B. Retail Sales of Electr
- Page 129 and 130:
Table 5.5.B. Revenue from Retail Sa
- Page 131 and 132:
Table 5.6.B. Average Retail Price o
- Page 133 and 134:
Appendix A Relative Standard Error
- Page 135 and 136:
Table A1.B. Relative Standard Error
- Page 137 and 138:
Table A2.A. Relative Standard Error
- Page 139 and 140:
Table A2.B. Relative Standard Error
- Page 141 and 142:
Table A3.A. Relative Standard Error
- Page 143 and 144:
Table A3.B. Relative Standard Error
- Page 145 and 146:
Table A4.A. Relative Standard Error
- Page 147 and 148:
Table A4.B. Relative Standard Error
- Page 149 and 150:
Table A5.A. Relative Standard Error
- Page 151 and 152:
Table A5.B. Relative Standard Error
- Page 153 and 154:
Table A6.A. Relative Standard Error
- Page 155 and 156:
Table A7.A. Relative Standard Error
- Page 157 and 158:
Table A8.A. Relative Standard Error
- Page 159 and 160:
Appendix B Major Disturbances and U
- Page 161 and 162:
05/25/11 Duke Energy Midwest(RFC) 1
- Page 163 and 164:
Table B.1. Major Disturbances and U
- Page 165 and 166:
Table B.2. Major Disturbances and U
- Page 167 and 168:
Table B.2. Major Disturbances and U
- Page 169 and 170:
The Energy Information Administrati
- Page 171 and 172:
Data Sources For Electric Power Mon
- Page 173 and 174:
ate charged by the electric utility
- Page 175 and 176:
data only on fossil-steam plants, b
- Page 177 and 178:
contents of the components of MSW w
- Page 179 and 180:
Construction 23 Manufacturing 311 F
- Page 181 and 182:
Table C2. Comparison of Preliminary
- Page 183 and 184:
Table C4. Unit-of-Measure Equivalen
- Page 185 and 186:
20 Knaub, J.R., Jr. (2003), “Appl
- Page 187 and 188:
such as briquettes, pellets, or ext
- Page 189 and 190:
order to provide, distribute, and s
- Page 191 and 192:
station(s) for station service or a
- Page 193:
concentrations of 1 percent or less