Electric Power Monthly February 2012 - EIA
Electric Power Monthly February 2012 - EIA
Electric Power Monthly February 2012 - EIA
You also want an ePaper? Increase the reach of your titles
YUMPU automatically turns print PDFs into web optimized ePapers that Google loves.
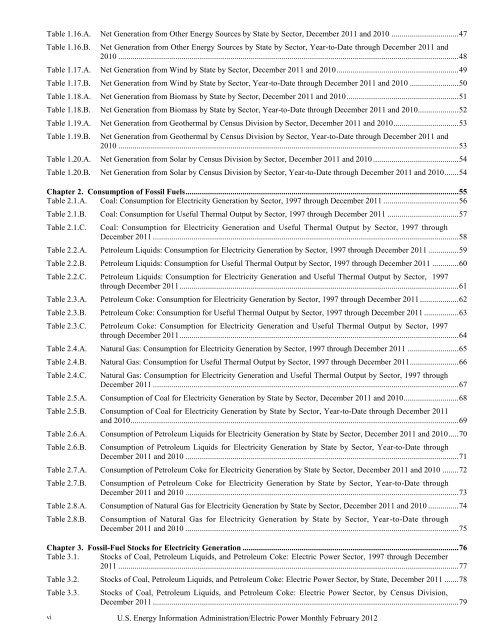
Table 1.16.A. Net Generation from Other Energy Sources by State by Sector, December 2011 and 2010 ................................. 47<br />
Table 1.16.B. Net Generation from Other Energy Sources by State by Sector, Year-to-Date through December 2011 and<br />
2010 ....................................................................................................................................................................... 48<br />
Table 1.17.A. Net Generation from Wind by State by Sector, December 2011 and 2010 ............................................................ 49<br />
Table 1.17.B. Net Generation from Wind by State by Sector, Year-to-Date through December 2011 and 2010 ........................ 50<br />
Table 1.18.A. Net Generation from Biomass by State by Sector, December 2011 and 2010 ....................................................... 51<br />
Table 1.18.B. Net Generation from Biomass by State by Sector, Year-to-Date through December 2011 and 2010.................... 52<br />
Table 1.19.A. Net Generation from Geothermal by Census Division by Sector, December 2011 and 2010 ................................ 53<br />
Table 1.19.B. Net Generation from Geothermal by Census Division by Sector, Year-to-Date through December 2011 and<br />
2010 ....................................................................................................................................................................... 53<br />
Table 1.20.A. Net Generation from Solar by Census Division by Sector, December 2011 and 2010 .......................................... 54<br />
Table 1.20.B. Net Generation from Solar by Census Division by Sector, Year-to-Date through December 2011 and 2010 ....... 54<br />
Chapter 2. Consumption of Fossil Fuels ...................................................................................................................................... 55<br />
Table 2.1.A. Coal: Consumption for <strong>Electric</strong>ity Generation by Sector, 1997 through December 2011 ..................................... 56<br />
Table 2.1.B. Coal: Consumption for Useful Thermal Output by Sector, 1997 through December 2011 ................................... 57<br />
Table 2.1.C. Coal: Consumption for <strong>Electric</strong>ity Generation and Useful Thermal Output by Sector, 1997 through<br />
December 2011 ...................................................................................................................................................... 58<br />
Table 2.2.A. Petroleum Liquids: Consumption for <strong>Electric</strong>ity Generation by Sector, 1997 through December 2011 ............... 59<br />
Table 2.2.B. Petroleum Liquids: Consumption for Useful Thermal Output by Sector, 1997 through December 2011 ............. 60<br />
Table 2.2.C. Petroleum Liquids: Consumption for <strong>Electric</strong>ity Generation and Useful Thermal Output by Sector, 1997<br />
through December 2011 ......................................................................................................................................... 61<br />
Table 2.3.A. Petroleum Coke: Consumption for <strong>Electric</strong>ity Generation by Sector, 1997 through December 2011 ................... 62<br />
Table 2.3.B. Petroleum Coke: Consumption for Useful Thermal Output by Sector, 1997 through December 2011 ................. 63<br />
Table 2.3.C. Petroleum Coke: Consumption for <strong>Electric</strong>ity Generation and Useful Thermal Output by Sector, 1997<br />
through December 2011 ......................................................................................................................................... 64<br />
Table 2.4.A. Natural Gas: Consumption for <strong>Electric</strong>ity Generation by Sector, 1997 through December 2011 ......................... 65<br />
Table 2.4.B. Natural Gas: Consumption for Useful Thermal Output by Sector, 1997 through December 2011 ........................ 66<br />
Table 2.4.C. Natural Gas: Consumption for <strong>Electric</strong>ity Generation and Useful Thermal Output by Sector, 1997 through<br />
December 2011 ...................................................................................................................................................... 67<br />
Table 2.5.A. Consumption of Coal for <strong>Electric</strong>ity Generation by State by Sector, December 2011 and 2010 ........................... 68<br />
Table 2.5.B. Consumption of Coal for <strong>Electric</strong>ity Generation by State by Sector, Year-to-Date through December 2011<br />
and 2010 ................................................................................................................................................................. 69<br />
Table 2.6.A. Consumption of Petroleum Liquids for <strong>Electric</strong>ity Generation by State by Sector, December 2011 and 2010 ..... 70<br />
Table 2.6.B. Consumption of Petroleum Liquids for <strong>Electric</strong>ity Generation by State by Sector, Year-to-Date through<br />
December 2011 and 2010 ...................................................................................................................................... 71<br />
Table 2.7.A. Consumption of Petroleum Coke for <strong>Electric</strong>ity Generation by State by Sector, December 2011 and 2010 ........ 72<br />
Table 2.7.B. Consumption of Petroleum Coke for <strong>Electric</strong>ity Generation by State by Sector, Year-to-Date through<br />
December 2011 and 2010 ...................................................................................................................................... 73<br />
Table 2.8.A. Consumption of Natural Gas for <strong>Electric</strong>ity Generation by State by Sector, December 2011 and 2010 ............... 74<br />
Table 2.8.B. Consumption of Natural Gas for <strong>Electric</strong>ity Generation by State by Sector, Year -to-Date through<br />
December 2011 and 2010 ...................................................................................................................................... 75<br />
Chapter 3. Fossil-Fuel Stocks for <strong>Electric</strong>ity Generation .......................................................................................................... 76<br />
Table 3.1. Stocks of Coal, Petroleum Liquids, and Petroleum Coke: <strong>Electric</strong> <strong>Power</strong> Sector, 1997 through December<br />
2011 ....................................................................................................................................................................... 77<br />
Table 3.2. Stocks of Coal, Petroleum Liquids, and Petroleum Coke: <strong>Electric</strong> <strong>Power</strong> Sector, by State, December 2011 ....... 78<br />
Table 3.3. Stocks of Coal, Petroleum Liquids, and Petroleum Coke: <strong>Electric</strong> <strong>Power</strong> Sector, by Census Division,<br />
December 2011 ...................................................................................................................................................... 79<br />
vi<br />
U.S. Energy Information Administration/<strong>Electric</strong> <strong>Power</strong> <strong>Monthly</strong> <strong>February</strong> <strong>2012</strong>


