

Electric Power Monthly February 2012 - EIA
Electric Power Monthly February 2012 - EIA
Electric Power Monthly February 2012 - EIA

You also want an ePaper? Increase the reach of your titles
YUMPU automatically turns print PDFs into web optimized ePapers that Google loves.
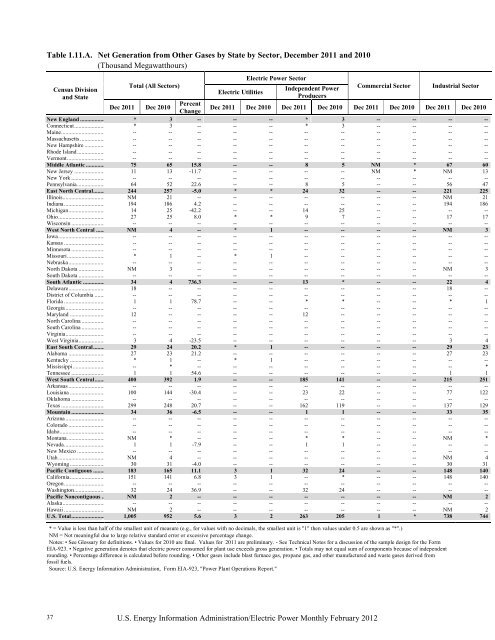
Table 1.11.A. Net Generation from Other Gases by State by Sector, December 2011 and 2010<br />
(Thousand Megawatthours)<br />
37<br />
Census Division<br />
and State<br />
Total (All Sectors)<br />
<strong>Electric</strong> Utilities<br />
<strong>Electric</strong> <strong>Power</strong> Sector<br />
Independent <strong>Power</strong><br />
Producers<br />
U.S. Energy Information Administration/<strong>Electric</strong> <strong>Power</strong> <strong>Monthly</strong> <strong>February</strong> <strong>2012</strong><br />
Commercial Sector Industrial Sector<br />
Dec 2011 Dec 2010 Percent<br />
Change<br />
Dec 2011 Dec 2010 Dec 2011 Dec 2010 Dec 2011 Dec 2010 Dec 2011 Dec 2010<br />
New England ................. * 3 -- -- -- * 3 -- -- -- --<br />
Connecticut ..................... * 3 -- -- -- * 3 -- -- -- --<br />
Maine .............................. -- -- -- -- -- -- -- -- -- -- --<br />
Massachusetts ................. -- -- -- -- -- -- -- -- -- -- --<br />
New Hampshire .............. -- -- -- -- -- -- -- -- -- -- --<br />
Rhode Island ................... -- -- -- -- -- -- -- -- -- -- --<br />
Vermont .......................... -- -- -- -- -- -- -- -- -- -- --<br />
Middle Atlantic ............. 75 65 15.8 -- -- 8 5 NM * 67 60<br />
New Jersey ..................... 11 13 -11.7 -- -- -- -- NM * NM 13<br />
New York ....................... -- -- -- -- -- -- -- -- -- -- --<br />
Pennsylvania ................... 64 52 22.6 -- -- 8 5 -- -- 56 47<br />
East North Central........ 244 257 -5.0 * * 24 32 -- -- 221 225<br />
Illinois............................. NM 21 -- -- -- -- -- -- -- NM 21<br />
Indiana ............................ 194 186 4.2 -- -- -- -- -- -- 194 186<br />
Michigan ......................... 14 25 -42.2 -- -- 14 25 -- -- -- --<br />
Ohio ................................ 27 25 8.0 * * 9 7 -- -- 17 17<br />
Wisconsin ....................... -- -- -- -- -- -- -- -- -- -- --<br />
West North Central ...... NM 4 -- * 1 -- -- -- -- NM 3<br />
Iowa ................................ -- -- -- -- -- -- -- -- -- -- --<br />
Kansas ............................ -- -- -- -- -- -- -- -- -- -- --<br />
Minnesota ....................... -- -- -- -- -- -- -- -- -- -- --<br />
Missouri .......................... * 1 -- * 1 -- -- -- -- -- --<br />
Nebraska ......................... -- -- -- -- -- -- -- -- -- -- --<br />
North Dakota .................. NM 3 -- -- -- -- -- -- -- NM 3<br />
South Dakota .................. -- -- -- -- -- -- -- -- -- -- --<br />
South Atlantic ............... 34 4 736.3 -- -- 13 * -- -- 22 4<br />
Delaware ......................... 18 -- -- -- -- -- -- -- -- 18 --<br />
District of Columbia ....... -- -- -- -- -- -- -- -- -- -- --<br />
Florida ............................ 1 1 78.7 -- -- * * -- -- * 1<br />
Georgia ........................... -- -- -- -- -- -- -- -- -- -- --<br />
Maryland ........................ 12 -- -- -- -- 12 -- -- -- -- --<br />
North Carolina ................ -- -- -- -- -- -- -- -- -- -- --<br />
South Carolina ................ -- -- -- -- -- -- -- -- -- -- --<br />
Virginia ........................... -- -- -- -- -- -- -- -- -- -- --<br />
West Virginia .................. 3 4 -23.5 -- -- -- -- -- -- 3 4<br />
East South Central ........ 29 24 20.2 * 1 -- -- -- -- 29 23<br />
Alabama ......................... 27 23 21.2 -- -- -- -- -- -- 27 23<br />
Kentucky ........................ * 1 -- * 1 -- -- -- -- -- --<br />
Mississippi ...................... -- * -- -- -- -- -- -- -- -- *<br />
Tennessee ....................... 1 1 54.6 -- -- -- -- -- -- 1 1<br />
West South Central ....... 400 392 1.9 -- -- 185 141 -- -- 215 251<br />
Arkansas ......................... -- -- -- -- -- -- -- -- -- -- --<br />
Louisiana ........................ 100 144 -30.4 -- -- 23 22 -- -- 77 122<br />
Oklahoma ....................... -- -- -- -- -- -- -- -- -- -- --<br />
Texas .............................. 299 248 20.7 -- -- 162 119 -- -- 137 129<br />
Mountain ....................... 34 36 -6.5 -- -- 1 1 -- -- 33 35<br />
Arizona ........................... -- -- -- -- -- -- -- -- -- -- --<br />
Colorado ......................... -- -- -- -- -- -- -- -- -- -- --<br />
Idaho ............................... -- -- -- -- -- -- -- -- -- -- --<br />
Montana .......................... NM * -- -- -- * * -- -- NM *<br />
Nevada ............................ 1 1 -7.9 -- -- 1 1 -- -- -- --<br />
New Mexico ................... -- -- -- -- -- -- -- -- -- -- --<br />
Utah ................................ NM 4 -- -- -- -- -- -- -- NM 4<br />
Wyoming ........................ 30 31 -4.0 -- -- -- -- -- -- 30 31<br />
Pacific Contiguous ........ 183 165 11.1 3 1 32 24 -- -- 148 140<br />
California ........................ 151 141 6.8 3 1 -- * -- -- 148 140<br />
Oregon ............................ -- -- -- -- -- -- -- -- -- -- --<br />
Washington ..................... 32 24 36.9 -- -- 32 24 -- -- -- --<br />
Pacific Noncontiguous .. NM 2 -- -- -- -- -- -- -- NM 2<br />
Alaska ............................. -- -- -- -- -- -- -- -- -- -- --<br />
Hawaii ............................ NM 2 -- -- -- -- -- -- -- NM 2<br />
U.S. Total ....................... 1,005 952 5.6 3 2 263 205 1 * 738 744<br />
* = Value is less than half of the smallest unit of measure (e.g., for values with no decimals, the smallest unit is "1" then values under 0.5 are shown as "*".)<br />
NM = Not meaningful due to large relative standard error or excessive percentage change.<br />
Notes: • See Glossary for definitions. • Values for 2010 are final. Values for 2011 are preliminary. - See Technical Notes for a discussion of the sample design for the Form<br />
<strong>EIA</strong>-923. • Negative generation denotes that electric power consumed for plant use exceeds gross generation. • Totals may not equal sum of components because of independent<br />
rounding. • Percentage difference is calculated before rounding. • Other gases include blast furnace gas, propane gas, and other manufactured and waste gases derived from<br />
fossil fuels.<br />
Source: U.S. Energy Information Administration, Form <strong>EIA</strong>-923, "<strong>Power</strong> Plant Operations Report."


