Operations and Business Environment - Fresenius Medical Care
Operations and Business Environment - Fresenius Medical Care
Operations and Business Environment - Fresenius Medical Care

You also want an ePaper? Increase the reach of your titles
YUMPU automatically turns print PDFs into web optimized ePapers that Google loves.
02. 2<br />
Our Fiscal year<br />
72<br />
Earnings<br />
EBITDA. Earnings before Interest, Taxes, Depreciation<br />
<strong>and</strong> Amortization (EBITDA) were $ 1.63 billion in 2006,<br />
an increase of 37 % over the $1.19 billion of the previous<br />
year. The EBITDA includes the effects of the costs<br />
of an accounting change for stock options, one-time<br />
effects, restructuring costs <strong>and</strong> in-process R & D, <strong>and</strong> the<br />
costs of the transformation of the legal form <strong>and</strong> preference<br />
share conversion, as well as the gain from the<br />
divestiture of clinics in connection with the acquisition<br />
of Renal <strong>Care</strong> Group amounting to $11 million. Excluding<br />
these one-time effects <strong>and</strong> the accounting change,<br />
our EBITDA increased by 35 % to $1.64 billion.<br />
Operating Income (EBIT). Operating income (Earnings<br />
before Interest <strong>and</strong> Taxes – EBIT) also increased in 2006,<br />
rising by 40 % to $1.32 billion. The aforementioned<br />
one-time effects <strong>and</strong> the change of accounting principles<br />
accounted for $11 million. Excluding one-time items<br />
<strong>and</strong> the accounting change, operating income rose by<br />
38 % to $1.33 billion in 2006. This represents an EBIT<br />
margin of 15.6 % compared with 14.2 % in 2005. The<br />
significantly better operating margin is the result of<br />
a considerably higher gross profit margin as well as<br />
stable selling <strong>and</strong> administrative costs as a percentage<br />
of sales.<br />
Excluding one-time effects, operating income in North<br />
America rose by 49 % to $ 958 million last year after<br />
EBIT of $ 644 million in 2005. The operating margin<br />
also improved, excluding one-time costs, from 14. in<br />
2005 to 15.9 % in 2006. The primary reasons for this<br />
increase are the result of the improvement in<br />
revenue rates, increased treatment volume, effects of<br />
the RCG acquisition net of divestitures <strong>and</strong> increased<br />
product sales, partially offset by higher personnel<br />
expenses.<br />
In the International region, comprising all areas outside<br />
North America, we also recorded significant earnings<br />
growth in 2006. Operating income in this region increased<br />
by 22 %, rising from $ 362 million in 2005 to<br />
$ 440 million in the year under review. We were able to<br />
improve the operating margin from 16.5 % to 17.8 %.<br />
This was primarily due to accelerated purchases of<br />
product by German customers as a result of an increase<br />
by 3 % of the German value added tax (VAT) in<br />
2007, improvements in our operations in Latin America<br />
<strong>and</strong> Asia Pacific, collections on previously written off<br />
receivables, lower bad debt expense <strong>and</strong> the impact of<br />
restructuring costs in Japan in 2005. These effects were<br />
partially offset by income received in 2005 associated<br />
with the cancellation of a distribution agreement <strong>and</strong><br />
with a patent litigation settlement.<br />
Corporate costs for our central administration rose considerably<br />
in 2006. These are not included in the calculations<br />
for EBITDA <strong>and</strong> EBIT (operating income of the<br />
operating segments). <strong>Fresenius</strong> <strong>Medical</strong> <strong>Care</strong> believes<br />
these costs are not within the control of the individual<br />
segments. These corporate costs relate mainly to certain<br />
headquarters overhead charges such as accounting<br />
<strong>and</strong> finance as well as other staff functions. The total<br />
corporate operating cost was $ 87 million in 2006 compared<br />
to $ 67 million in 2005. The primary reasons for<br />
this increase are related to the accounting change<br />
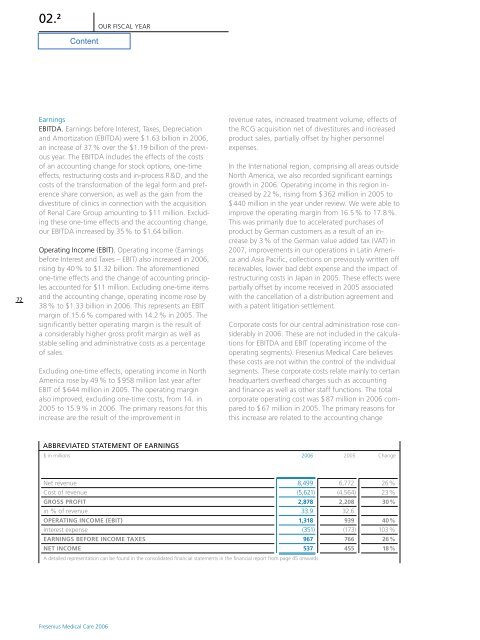
Abbreviated Statement of Earnings<br />
$ in millions 2006 2005 Change<br />
Net revenue<br />
Cost of revenue<br />
Gross profit<br />
in % of revenue<br />
Operating income (EBIT)<br />
Interest expense<br />
Earnings before income taxes<br />
Net income<br />
8,499<br />
(5,621)<br />
2,878<br />
33.9<br />
1,318<br />
(351)<br />
967<br />
537<br />
A detailed representation can be found in the consolidated financial statements in the financial report from page 45 onwards.<br />
6,772<br />
(4,564)<br />
2,208<br />
32.6<br />
939<br />
(173)<br />
766<br />
455<br />
26 %<br />
23 %<br />
30 %<br />
40 %<br />
103 %<br />
26 %<br />
18 %<br />
<strong>Fresenius</strong> <strong>Medical</strong> <strong>Care</strong> 2006