eu market survey 2003 - crecer
eu market survey 2003 - crecer
eu market survey 2003 - crecer

You also want an ePaper? Increase the reach of your titles
YUMPU automatically turns print PDFs into web optimized ePapers that Google loves.
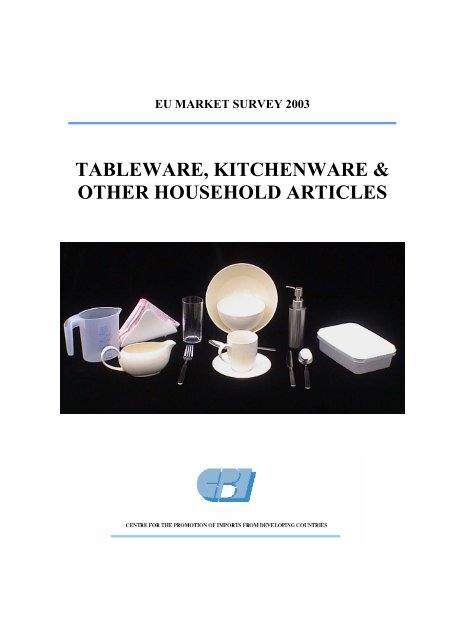
EU MARKET SURVEY <strong>2003</strong><br />
TABLEWARE, KITCHENWARE &<br />
OTHER HOUSEHOLD ARTICLES
EU MARKET SURVEY <strong>2003</strong><br />
TABLEWARE, KITCHENWARE &<br />
OTHER HOUSEHOLD ARTICLES<br />
Compiled for CBI by:<br />
Developing Countries B.V. The Netherlands<br />
December <strong>2003</strong><br />
DISCLAIMER<br />
The information provided in this <strong>market</strong> <strong>survey</strong> is believed to be accurate at the time of writing. It<br />
is, however, passed on to the reader without any responsibility on the part of CBI or the authors<br />
and it does not release the reader from the obligation to comply with all applicable legislation.<br />
Neither CBI nor the authors of this publication make any warranty, expressed or implied,<br />
concerning the accuracy of the information presented, and will not be liable for injury or claims<br />
pertaining to the use of this publication or the information contained therein.<br />
No obligation is assumed for updating or amending this publication for any reason, be it new or<br />
contrary information or changes in legislation, regulations or jurisdiction.<br />
COPYRIGHT<br />
No part of this <strong>market</strong> <strong>survey</strong> may be sold, reproduced in any form or by any means without the<br />
prior permission of CBI.<br />
Photo courtesy: Developing Countries B.V.<br />
2
Table of Contents<br />
EU Market Survey<br />
REPORT SUMMARY 5<br />
INTRODUCTION 8<br />
PART A: EU MARKET INFORMATION 10<br />
1 PRODUCT CHARACTERISTICS 11<br />
1.1 Product Groups 11<br />
1.2 Customs/Statistical Product Classification 12<br />
2 INTRODUCTION TO THE EU MARKET 13<br />
3 CONSUMPTION / INDUSTRIAL DEMAND 15<br />
3.1 Market size 15<br />
3.2 Market segmentation 19<br />
3.2.1 Market segmentation by product 19<br />
3.2.2 Market segmentation by user 24<br />
3.3 Consumption patterns and trends 25<br />
3.3.1 Demographic trends 25<br />
3.3.2 Social & Cultural trends 26<br />
3.3.3 Technical trends 28<br />
3.3.4 Economic trends 28<br />
4 PRODUCTION 29<br />
4.1 Production per product group 30<br />
5 IMPORTS 34<br />
5.1 Total imports 34<br />
5.2 Imports by product group 40<br />
5.3 The role of the Developing Countries 48<br />
6 EXPORTS 51<br />
7 TRADE STRUCTURE 56<br />
7.1 EU trade channels 56<br />
7.2 Intermediaries 56<br />
7.3 Retailers of table- & kitchenware 58<br />
7.4 Retail channels per country 60<br />
7.5 Distribution channels for developing country exporters 64<br />
8 PRICES & MARGINS 65<br />
8.1 Price development in the table- & kitchenware <strong>market</strong> 65<br />
8.2 Price levels in the EU 65<br />
8.3 Sources of price information 66<br />
9 REQUIREMENTS FOR ACCESS 67<br />
9.1 Non-tariff trade barriers 67<br />
9.2 Tariffs and quotas 74<br />
3
PART B: EXPORT MARKETING GUIDELINES 77<br />
10 EXTERNAL ANALYSIS 78<br />
10.1 Market developments and opportunities 78<br />
10.2 Competitive analysis 80<br />
10.3 Sales channel assessment 81<br />
10.4 Organisational Structures 82<br />
10.5 Logistics 83<br />
10.6 Price Structure 84<br />
10.7 Examples: Product Profiles 86<br />
11 INTERNAL ANALYSIS 88<br />
11.1 Product standards/ quality, Production capacity, Product design 88<br />
& development and Unique Selling Points<br />
11.2 Logistics 89<br />
11.3 Marketing and sales 90<br />
11.4 Financing 91<br />
11.5 Capabilities 91<br />
12 DECISION MAKING 93<br />
12.1 SWOT and situation analysis 93<br />
12.2 Strategic options & objectives 93<br />
13 MARKETING TOOLS 94<br />
13.1 Matching products and the product range 94<br />
13.2 Building up a relationship with a suitable trading partner 95<br />
13.3 Drawing up an offer 96<br />
13.4 Handling the contract 97<br />
13.5 Sales promotion 99<br />
APPENDICES 102<br />
1 DETAILED HS CODES 102<br />
2 DETAILED IMPORT STATISTICS 106<br />
3 DETAILED EXPORT STATISTICS 110<br />
4 USEFUL ADDRESSES 113<br />
4.1 Standards organisations 113<br />
4.2 Trade associations 114<br />
4.3 Trade fair organisers 116<br />
4.4 Trade press 118<br />
4.5 Other useful addresses 120<br />
5 LIST OF DEVELOPING COUNTRIES 122<br />
6 LIST OF ACP COUNTRIES 123<br />
7 LIST OF GSP COUNTRIES 124<br />
8 LIST OF PROCESSES WHICH CAUSE HARM TO HEALTH AND SAFETY 125<br />
New CBI publication with new format and contents partly replacing CBI <strong>market</strong> <strong>survey</strong> “Tableware,<br />
Kitchenware and Household Articles of Wood, Metal, Glass and Plastic” (September 1999)<br />
4
REPORT SUMMARY<br />
This <strong>survey</strong> profiles the EU <strong>market</strong> for tableware, kitchenware & other household articles, further<br />
called table- & kitchenware. The emphasis of this <strong>survey</strong> lies on those products which are of<br />
importance to suppliers based in developing countries. The products discussed in this <strong>survey</strong><br />
include: metalware, plasticware, glassware, ceramicware, china & porcelain, cutlery and<br />
woodware. The major national <strong>market</strong>s of France, United Kingdom, Italy, Germany, Spain and<br />
the Netherlands are highlighted. Part A of this <strong>survey</strong> includes statistical <strong>market</strong> information on<br />
consumption, production, trade, trade structure and requirements for access. As an exporter, you<br />
will need this information in order to formulate your own <strong>market</strong> and product strategies. Part B of<br />
this <strong>survey</strong> contains export-<strong>market</strong>ing Guidelines, a practical handbook for exporters engaged, or<br />
wishing to engage, in exporting table- & kitchenware to the European Union.<br />
Consumption<br />
In 2002, the total value of the EU-<strong>market</strong> for table- & kitchenware was estimated to be about<br />
€ 18.3 billion, indicating a growth of 4 percent compared to the previous year. It should be noted<br />
that metalware and woodware are not included in this Figure, because statistics concerning these<br />
<strong>market</strong>s are not compiled by the research agency Euromonitor. France is by far the biggest table-<br />
& kitchenware <strong>market</strong> accounting for 27 percent of the total EU-consumption, followed by the<br />
United Kingdom (19%), Italy (16%), Germany (15%), Spain (7%) and the Netherlands (4%). In<br />
the table below you can find a more detailed overview of the countries discussed.<br />
In recent years, people’s lifestyles, and their attitudes toward their home have changed.<br />
Consumers around the world have turned towards a more casual lifestyle. This development has<br />
had a notable influence on the table- & kitchenware <strong>market</strong>. During the last decade, the <strong>market</strong><br />
has steadily shifted from a formal style, which was the traditional backbone of the industry,<br />
towards a more informal and fashionable style. This development is even noted in the more<br />
formal <strong>market</strong>s like France and Italy. According to sources on the Birmingham Autumn fair,<br />
trends in the table- & kitchenware <strong>market</strong> are expected to change significantly every twelve to<br />
eighteen months.<br />
Overview of EU tradebalance, by country in € millions (consumption figures exclusive metalware<br />
and woodware)<br />
Consumption Consumption Import Export Trade balance<br />
2001 2002 2001 2001 2001<br />
France 4,717 4,884 1,157 1,852 695<br />
United Kingdom 3,286 3,422 1,410 710 -700<br />
Italy 2,741 2,873 695 1,741 1,046<br />
Germany 2,693 2,760 1,828 1,484 -344<br />
Spain 1,166 1,232 553 377 -176<br />
The Netherlands 619 657 624 423 -201<br />
EU-total 17,612 18,342 8,368 8,605 237<br />
Sources: Eurostat & Euromonitor, 2002/<strong>2003</strong><br />
Production<br />
Over the last decade, the table- & kitchenware <strong>market</strong> is become increasingly competitive, mainly<br />
due to the pressure of low-cost imports, principally from Asia and Eastern Europe. A more<br />
expensive labour force and strict regulations in the EU countries have made it difficult for EU<br />
manufacturers to compete. To cope with the increasing competition, several EU manufacturers<br />
established manufacturing bases in Asia, where they could combine their state-of-the-art<br />
technology with a low cost base. In this way, they could maintain an efficient, high-quality<br />
production system at low cost. Another answer to the increasing competition was to achieve<br />
“economics of scale”. Mergers and acquisitions were a popular means to build the scale necessary<br />
to survive. This led to the development of large multinationals, which are present worldwide.<br />
5
Increasing rivalry in other sectors, like the food sector, also contributed to the increasing<br />
competitiveness of the table- & kitchenware <strong>market</strong>. Because of the relatively high margins and<br />
the need to create more “traffic”, retailers, like grocery multiples and discounters, started selling<br />
table- & kitchenware. They mainly sell low-priced products, often private label. This undermined<br />
the position of the EU manufacturers, which were mostly positioned in the premium-end of the<br />
<strong>market</strong>. Many manufacturers searched for ways to differentiate their products, and branding<br />
therefore became more important.<br />
Imports<br />
In 2001, the total import of table- & kitchenware was € 8.4 billion and 2.5 million tons, indicating<br />
a small decrease of 1 percent in terms of value in comparison with 2000. In the years preceding<br />
2001, EU imports showed a healthy development. In the period between 1997 and 2000, the EUimport<br />
of table- & kitchenware grew in terms of value, on average, about 5 percent annually.<br />
Apparently, the stagnation of the economy in 2001 has had its influence on the import of table- &<br />
kitchenware. Germany is the leading importer, accounting for 22 percent of the total imported<br />
value by EU member countries, followed by the United Kingdom (17%), France (14%), Italy<br />
(8%), The Netherlands (8%), and Spain (7%).<br />
The share of table- & kitchenware supplied by EU-countries is declining. In 1992, the EUmember<br />
countries still accounted for 66 percent of all imported table- & kitchenware. In 2001,<br />
this percentage dropped to 52 percent. This decrease can be explained by the increasing<br />
competition from low-priced products deriving from Asian manufacturers, mainly in China, and<br />
the outsourcing trend to Asia of many EU manufacturers.<br />
In 2001, metalware (24%) was the leading import product group, followed by plasticware (24%,<br />
glassware (22%), cutlery (11%), porcelain & china (10%), ceramicware (7%) and woodware<br />
(2%) (See Figure 5.2 for more information). Of the total import, 28 percent derives from<br />
developing countries, where China takes the largest share (see Table 5.1). In the woodware and<br />
cutlery imports, developing countries hold the strongest positions (see Table 5.1). In the<br />
glassware and plasticware imports, the position of developing countries is relatively weak. This is<br />
mainly caused by fact that the Western glassware and plasticware industry is very dominant.<br />
Export<br />
The EU is home to the largest table- & kitchenware exporters in the world, like France, Italy and<br />
Germany. In 2001, the EU-countries together exported € 8.6 billion of table- & kitchenwares.<br />
The largest exporter of table- & kitchenware in the EU was France. France accounted for 22<br />
percent of the total exported value in 2001. Other key exporting countries were Italy (20%),<br />
Germany (17%), Belgium (9%) and the United Kingdom (8%). The main products exported by<br />
EU-countries are Glassware (31% of total EU export), followed by metalware (23%), plasticware<br />
(19%), porcelain & china (11%), ceramicware (8%), cutlery (8%) and woodware (1%).<br />
Metalware became more important for EU exports, explained by the fact that, because of<br />
increasing competition, EU manufacturers turned to the more complex products like metalware.<br />
These products require high-tech production processes (See also Chapter 4).<br />
Trade balance<br />
Of the six countries discussed, France and Italy show a positive trade balance, indicating that<br />
their export is bigger than their import. The United Kingdom together with Germany, show the<br />
largest deficit, the first importing € 700 million more than they export.<br />
6
Opportunities<br />
Because of the increasing competition in the table- & kitchenware <strong>market</strong>, it is increasingly<br />
difficult for manufacturers, especially small-scale ones, to retain a profitable share of the EU<br />
<strong>market</strong>s. Although the developing countries share of EU imports is growing, it should be noted<br />
that this growth is partly due to outsourcing by Western manufacturers on the one hand and a<br />
number of large manufacturers mainly based in China and Thailand, on the other. Chinese exports<br />
make up between 37 and 82 percent of the EU imports deriving from developing countries (See<br />
Table 5.1).<br />
The shift towards more informal and casual table- & kitchenwares has led table- & kitchenwares<br />
becomes a more fashionable <strong>market</strong>, with new trends, designs and colours emerging every twelve<br />
to eighteen months. The trend towards a more fashionable <strong>market</strong> however, has some<br />
implications like, for example, shorter product life-cycles, making fast and accurate distribution<br />
indispensable. This offers chances for small-scale manufacturers to tap into specific <strong>market</strong><br />
developments. Table- & kitchenwares that are new, innovative and have a reasonable amount of<br />
quality, practicality and functionality, will be viable. Items which are highly original in terms of<br />
colour and design are promising, because they allow retailers as well as consumers to<br />
differentiate themselves. Up-to-date information on trends and developments is therefore more<br />
important than ever. Overseas companies that want to tap into the EU <strong>market</strong> have to be aware of<br />
the <strong>market</strong> developments. International and domestic trade fairs, exhibits and visits to shops in the<br />
export country offer valuable information and provide opportunities to build good relationships<br />
with importers and retailers.<br />
This <strong>survey</strong> offers you a framework for deciding whether or not to export to the European Union<br />
and, if you decide to do so, this <strong>survey</strong> provides you with leads and guidelines to assist your<br />
decision-making regarding which products and <strong>market</strong>s to focus on. For information on current<br />
CBI Programmes, training & seminars, and on how to download <strong>market</strong> information and CBI<br />
News Bulletins, please refer to CBI’s internet site www.cbi.nl.<br />
7
INTRODUCTION<br />
This CBI <strong>survey</strong> consists of two parts: EU Market Information and EU Market Access<br />
Requirements (Part A), and Export Marketing Guidelines (Part B).<br />
Market Survey<br />
Part A<br />
EU Market Information and Market Access Requirements<br />
EU Market Information (Chapters 1-8)<br />
Product characteristics<br />
Introduction to the EU <strong>market</strong><br />
Consumption and production<br />
Imports and exports<br />
Trade structure<br />
Prices<br />
EU Market Access Requirements (Chapter<br />
9)<br />
Quality and grading standards<br />
Environmental, social and health & safety<br />
issues<br />
Packaging, marking and labelling<br />
Tariffs and quotas<br />
Part B<br />
Export Marketing Guidelines: Analysis and Strategy<br />
External Analysis (<strong>market</strong> audit)<br />
(Chapter 10)<br />
Opportunities & Threats<br />
Decision<br />
Making<br />
(Chapter 12)<br />
Internal Analysis (company audit)<br />
(Chapter 11)<br />
Strengths & Weaknesses<br />
SWOT and situation analysis:<br />
Target <strong>market</strong>s and segments<br />
Positioning and improving competitiveness<br />
Suitable trade channels and business partners<br />
Other critical conditions and success factors (others than mentioned)<br />
Strategic options & objectives<br />
Export Marketing<br />
(Chapter 13)<br />
Matching products and product range<br />
Building up a trade relationship<br />
Drawing up an offer<br />
Handling the contract<br />
Sales promotion<br />
Chapters 1 to 8 of Part A profile the EU <strong>market</strong> for table- & kitchenware. The emphasis of the<br />
<strong>survey</strong> lies on those products which are of importance to developing country suppliers. The major<br />
national <strong>market</strong>s within the EU for those products are highlighted. Furthermore, statistical <strong>market</strong><br />
information on consumption, production and trade, and information on trade structure and<br />
opportunities for exporters is provided. Chapter 9 subsequently describes the requirements, which<br />
have to be fulfilled in order to get <strong>market</strong> access for the product sector concerned. It is,<br />
furthermore, of vital importance that exporters comply with the requirements of the EU <strong>market</strong> in<br />
terms of product quality, packaging, labelling and social, health & safety and environmental<br />
standards.<br />
8
After having read Part A, it is important for an exporter to analyse target <strong>market</strong>s, sales channels<br />
and potential customers in order to formulate export <strong>market</strong>ing and product strategies. Part B<br />
therefore aims to assist (potential) exporters from developing countries in their export –decisionmaking<br />
process.<br />
After having assessed the external (Chapter 10) and internal environment (Chapter 11), the<br />
(potential) exporter should be able to determine whether there are interesting export <strong>market</strong>s for<br />
his company. In fact, by matching external opportunities and internal capabilities, the exporter<br />
should be able to identify suitable target countries, <strong>market</strong> segments and target product(s) within<br />
these countries, and possible trade channels to export the selected products (Chapter 12).<br />
Chapter 13 subsequently describes <strong>market</strong>ing tools which, can be of assistance in successfully<br />
achieving the identified export objectives.<br />
The <strong>survey</strong> is interesting for both starting exporters as well as well as exporters already engaged<br />
in exporting (to the EU <strong>market</strong>). Part B is especially interesting for more experienced exporters<br />
starting to export to the EU and exporters looking for new EU <strong>market</strong>s, sales channels or<br />
customers. Starting exporters are advised to read this publication together with the CBI’s Export<br />
planner, a guide that shows systematically how to set up export activities.<br />
9
PART A<br />
EU Market Information and Market Access Requirements<br />
10
1 PRODUCT CHARACTERISTICS<br />
This <strong>survey</strong> analyses the <strong>market</strong> for table- & kitchenware and other household articles in the<br />
European Union. Naturally, the category is broad, and includes a wide range of applications from<br />
storage containers to laundry- and waste-baskets. For the purposes of this report, the EU-<strong>market</strong><br />
for table- & kitchenware is segmentated into seven categories, depending on the material it is<br />
made from. The following segments are distinguished: glassware, ceramicware, china &<br />
porcelain, cutlery, plasticware, metalware and woodware. Because of this division, there is some<br />
overlap between ceramicware and china & porcelain and between cutlery and metalware. The<br />
product sectors covered in this report are discussed in paragraph 1.1.<br />
This <strong>survey</strong> does not include small domestic electrical household appliances such as, for example,<br />
coffee makers. Related CBI <strong>survey</strong>s are the reports concerning “Gifts and decorative articles”<br />
and “Stationery items, office and school supplies”. The report concerning “Gifts and decorative<br />
articles” covers candles, artificial flowers and fruits, decorative glassware, basketwork and<br />
suchlike. The “Stationery items, office and school supplies” report covers paper products, writing<br />
and drawing instruments and other office materials.<br />
1.1 Product groups<br />
In this paragraph, we will give a short definition of the seven product groups included in this<br />
<strong>survey</strong>. Most product groups include a number of different products. However, for the ease of use<br />
and the extent of information available, the <strong>survey</strong> does not specify the different products<br />
included in product segments. It is also possible to divide the <strong>market</strong> into different functionalities,<br />
such as cookware and tableware. This, however, causes an overlap in the segmentation above.<br />
Cookware, for example, includes products of materials such as ceramic, glass and metal.<br />
Therefore, we have chosen a segmentation based on the different materials used.<br />
Plasticware<br />
Plasticware consists of storage products like cups, containers, etc. It also includes plastic<br />
tableware like plates, mugs, jars etc. Cleaning equipment such as bowls, buckets and drainers are<br />
also included in this group.<br />
Glassware<br />
The glassware segment can be divided in to three types of products, each having it own specific<br />
purpose. “Drinking glasses” is the first and one of the largest groups. It includes tumblers,<br />
crystalware and stemware. The second group is glass cookware, including glass pots, pans and<br />
heat-resident casseroles. The third group is glass tableware, which includes glass plates, serving<br />
dishes etc.<br />
Ceramicware<br />
Ceramicware includes cookware, such as casseroles and oven-to-tableware. It furthermore<br />
consists of non-china ceramics, like earthenware and stoneware. Other products, such as mugs,<br />
storage jars, jugs and pitchers are also included in this segment.<br />
China & Porcelain<br />
The china & porcelain segment is closely linked with ceramicware. This could mean that there is<br />
some overlap between these segments. China and porcelain is defined as fine semi-transparent or<br />
white earthenware. It includes dinner services and individual items of china tableware.<br />
11
Cutlery<br />
Included in the cutlery category are kitchen utensils such as knives, ladles and scissors. It also<br />
includes table cutlery like knives, forks and spoons for eating and serving. All types of materials<br />
are included, such as metal, silver, silver plate and stainless steel.<br />
Metalware<br />
The metalware segment includes all types of metals such as silver, silver-plate, stainless steel,<br />
hard-anodised steel, aluminium, etc. Metalware can be divided into five main categories:<br />
• Cookware, including pots, pans and pressure cookers;<br />
• Bakeware, including baking trays and sheets;<br />
• Tableware, including plates as well as holloware;<br />
• Gadgets, such as graters, can openers, garlic crushers and pizza wheels;<br />
• Accessories, such as bread bins, cocktail shakers and trivets.<br />
Woodware<br />
The smallest segment consists of wooden table- & kitchenwares, including products such as<br />
chopping boards, bowls, bread bins and spice racks, all made of wood. Because information on<br />
this segment is very limited, it is not possible to give accurate figures concerning the consumption<br />
of these products.<br />
1.2 Statistical products classification<br />
The nomenclature for statistics within the Europe Union does not specify table- & kitchenware as<br />
such. The trading classification systems used were unified by the introduction of a new,<br />
worldwide coding system, introduced on January 1, 1988. This system is called the Harmonized<br />
Commodity Description System (HS) and was developed by the World Customs Organisation<br />
(WCO). The system comprises about 5,000 commodity groups; each identified by a six-digit<br />
code, arranged in a legal and logical structure, and is supported by well-defined rules to achieve<br />
uniform classification. More than 177 countries and economies use the system as a basis for their<br />
customs tariffs and for the collection of international trade statistics. WCO has introduced some<br />
alterations to the HS and these are included in the combined nomenclature as of January 1, 2002.<br />
After the six-digit code, countries are free to use further subheadings. An 8-digit system is used in<br />
the trade data of Eurostat. Most codes, however, end with two zeros, i.e. effectively only using six<br />
digits. Although in some countries ten digits are occasionally used.<br />
Table 1.1 Harmonised System (HS) classification table- & kitchenware<br />
Product group<br />
Heading HS codes<br />
Plasticware 3924<br />
Woodware 4419<br />
Porcelain & China 6911<br />
Ceramicware 6912<br />
Glassware (incl. crystal) 7013<br />
Metalware 7323 / 7417 / 7418 /7615<br />
Cutlery 8211 / 8215<br />
In order to make this <strong>market</strong> <strong>survey</strong>/guide operational, the <strong>survey</strong> has been limited to describing<br />
the above selected product groups. The HS classification given in Table 1.1 differs in some<br />
extend from the classification mentioned in Paragraph 1.1, which puts limitations to in-depth<br />
interpretation of trade figures and of the possible relationships between import and export figures<br />
on the one hand and production and consumption figures on the other hand. For a more detailed<br />
list of product groups, please refer to Appendix 1.<br />
12
2 INTRODUCTION TO THE EU-MARKET<br />
The European Union (EU) is the current name for the former European Community. Since 1<br />
January 1995, the EU consists of 15 member states. Ten new countries will join the European<br />
Union in 2004; these so-called “accession countries” are Poland, Lithuania, Estonia, Latvia,<br />
Hungary, the Czech Republic, Slovenia, Slovakia, Malta and Cyprus. According to Eurostat, the<br />
EU will grow from 15 countries with 379.6 million residents to 25 countries with approximately<br />
450 million residents. Negotiations are in progress with a number of other candidate member<br />
states.<br />
Table 2.1 Population and GDP of selected EU-countries, 2002<br />
Population (<strong>2003</strong>) Age 15-64 GDP (2002) GDP (2002)<br />
(Million) (€ Billion) (Per capita in €)<br />
Germany 83.3 68% 2,206 26,200<br />
United Kingdom 59,8 66% 1,485 25,500<br />
France 59,8 65% 1,556 26,000<br />
Italy 57,7 67% 1,416 25,100<br />
Spain 40,1 68% 836 21,200<br />
The Netherlands 16,0 68% 417 27,200<br />
Sources: Eurostat & World Fact book, 2002/<strong>2003</strong><br />
Within Western Europe – covering 15 EU member countries, Iceland, Liechtenstein, Norway and<br />
Switzerland – more than 20 million enterprises are active. Small and medium-sized enterprises<br />
(SME’s) accounted for the lion’s share. In 2000, the average turnover per enterprise of SME’s<br />
and large enterprises amounted to € 600,000 and € 255 million respectively.<br />
EU Harmonisation<br />
The most important aspect of the process of unification (of<br />
the former EC countries), which affects trade, is the<br />
harmonisation of rules in the EU-countries. As unification<br />
allows free movement of capital, goods, services and<br />
people, internal borders have been removed. Goods<br />
produced or imported into one member state can be moved<br />
around between the other member states without<br />
restriction. A precondition for this free movement is<br />
uniformity in the rules and regulations concerning locally<br />
produced or imported products. Although the European<br />
Table 2.2<br />
Overview 15 EU member<br />
countries 2002<br />
Population 379.6 million<br />
Area 31,443,000 km 2<br />
Density 83 people per km 2<br />
Languages 11 (excl. dialects)<br />
GDP/capita € 21,023<br />
Currencies €, UK£, DKr., SKr.<br />
Exchange € 1 = US$ 1.26<br />
(31/12/<strong>2003</strong>)<br />
Union is already a fact, not all the regulations have yet been harmonised. Work is in progress in<br />
the fields of environmental pollution, health, safety, quality and education. For more information<br />
about harmonisation of the regulations, visit AccessGuide, CBI’s database on non-tariff trade<br />
barriers at www.cbi.nl/accessguide.<br />
Monetary unit: Euro<br />
On 1 January 1999, the <strong>eu</strong>ro became the legal currency within twelve EU member states: Austria,<br />
Belgium, Finland, France, Germany, Greece, Italy, Ireland, Luxembourg, The Netherlands, Spain,<br />
and Portugal. In 2002, circulation of Euro coins and banknotes replaced national currencies in<br />
these countries. Denmark, United Kingdom and Sweden have decided not to participate in the<br />
Euro.<br />
The most recent Eurostat trade statistics quoted in this <strong>survey</strong> are from the year 2001. In this<br />
<strong>market</strong> <strong>survey</strong>, the € is the basic currency unit used to indicate value.<br />
13
The information used in this <strong>market</strong> <strong>survey</strong> was obtained from a variety of sources. The lion’s<br />
share of information derives from research agencies, such as Euromonitor, Eurostat, Mintel and<br />
Key Note. In addition, other published information has been used, to broaden the view of the<br />
<strong>market</strong>. Other methods used to collect information were trade interviews, store checks and desk<br />
research. Because of the variety of sources used, extreme care must be taken in the qualitative use<br />
and interpretation of the quantitative data in this <strong>survey</strong>.<br />
The collection of data regarding trade flows has become more difficult since the establishment of<br />
the single European <strong>market</strong> on 1 January 1993. Until that date, trade was registered by means of<br />
compulsory customs procedures at border crossings but, since the removal of the intra-EU<br />
borders, this is no longer the case. Statistical bodies like Eurostat cannot now depend on the<br />
automatic generation of trade figures. In the case of intra-EU trade, statistical reporting is only<br />
compulsory for exporting and importing firms whose trade exceeds a certain annual value. The<br />
threshold varies considerably from country to country, but it is typically about € 100,000.<br />
Therefore, although figures for trade between the EU and the rest of the world are accurately<br />
represented, trade within the EU is generally underestimated.<br />
For more detailed information on <strong>market</strong> research, reference is made to CBI’s Export Planner<br />
(2000).<br />
This <strong>survey</strong> profiles the EU <strong>market</strong> for table- & kitchenware, in which six selected <strong>market</strong>s within<br />
the EU are highlighted. The selection is based on a quantitative and qualitative comparison of<br />
consumption, production and imports/exports of the EU member countries, as will be further<br />
explained in the following chapters of this <strong>survey</strong>. The countries selected for this <strong>survey</strong> are<br />
Germany, United Kingdom, France, Italy, The Netherlands and Spain, which are the largest<br />
consuming countries for table- & kitchenware in the EU. In 2002, these countries together<br />
accounted for nearly 86% of total EU consumption.<br />
14
3 CONSUMPTION<br />
This chapter presents a general overview of the <strong>market</strong> for table- & kitchenware in the European<br />
Union, highlighting the countries and products specified in chapter 1 and 2. The information used<br />
is largely based on the reports of Euromonitor and Mintel. Furthermore, various articles published<br />
by different institutes are used. The information from these sources can, however, include<br />
consumption data of products that are beyond the extent of this <strong>survey</strong>, whilst they exclude<br />
consumption data of articles that may be relevant. Therefore, the information in chapter is not<br />
unequivocal.<br />
It must be noted that detailed, up-to-date statistics on the segments woodware and metalware are<br />
not available. However, because of the importance of the metalware segment, we have used<br />
statistics for the year 1999, in order to present some insight in this segment and we have<br />
extrapolated the figures for consumption rates of this product segment. This extrapolation only<br />
provides an indication of the metalware <strong>market</strong>.<br />
3.1 Market size<br />
The EU retail <strong>market</strong> for table- & kitchenware is mature and stable. In 2002, the total value of the<br />
EU <strong>market</strong> for table- & kitchenware was estimated to be about € 18.3 billion, indicating a growth<br />
of 4 percent compared to the previous year. It should be noted that metalware and woodware are<br />
not included in this figure. In the last decade, the <strong>market</strong> has steadily shifted from formal table- &<br />
kitchenware to a more informal and casual style. Informal and practical products are becoming<br />
increasingly important, even in countries with a profound formal tradition like Italy and France.<br />
This trend is reflected in the popularity of plasticware, which was one of the star performers in<br />
the period 1998 to 2002. In this period, the EU consumption of plasticwares grew by almost 25<br />
percent.<br />
Figure 3.1<br />
Table- & kitchenware <strong>market</strong>: relative attractiveness (excl. metalware and woodware)<br />
based on € value<br />
8%<br />
% growth 2002<br />
7%<br />
6%<br />
5%<br />
4%<br />
3%<br />
Ireland<br />
Netherlands<br />
Denmark<br />
Sweden<br />
France Belgium<br />
Austria<br />
Greece<br />
Spain<br />
Finland<br />
Italy<br />
Portugal<br />
United Kingdom<br />
2%<br />
Germany<br />
1%<br />
0%<br />
-5% 0% 5% 10% 15% 20% 25% 30% 35% 40%<br />
% growth 1998 - 2002<br />
Source: Euromonitor, <strong>2003</strong><br />
15
France is by far the biggest table- & kitchenware <strong>market</strong>, accounting for 27 percent of the total<br />
EU consumption. At a considerable distance, we find the United Kingdom (19%) and Italy<br />
(16%), which pushed Germany out of the top three. As can be seen in Figure 3.1, the United<br />
Kingdom and Portugal represent the fastest growth in the review period (1998 to 2002). Both<br />
grew by approximately 30 percent (horizontal axis) during that period. Solely looking at 2002,<br />
Greece was the star performer, as the Greek <strong>market</strong> grew by 7 percent that year (vertical axis).<br />
The German <strong>market</strong>, which is located on the left-bottom side of Figure 3.1, remained rather<br />
stable, the <strong>market</strong> only growing by 2 percent in 2002. The countries located in the top-right<br />
corner of Figure 3.1 achieved the most growth over the review period.<br />
With a share of 32 percent, the plasticware <strong>market</strong> is the biggest table- & kitchenware <strong>market</strong>. In<br />
2002, the plasticware <strong>market</strong> represented a value of € 5.9 billion.<br />
Figure 3.2<br />
Table- & kitchenware products shares<br />
in EU, 2002, % of total value<br />
Figure 3.3<br />
Table- & kitchenware consumption by<br />
EU-member countries, 2002, % of EUtotal<br />
China &<br />
Porcelain<br />
Cutlery<br />
11.0%<br />
13.9%<br />
China &<br />
Porcelain,<br />
Ceramicware 13.0%<br />
16.8%<br />
Ceramicware<br />
, 16.8%<br />
Cutlery,<br />
11.0%<br />
Glassware<br />
27.2%<br />
Plasticware<br />
31.9%<br />
Plasticware,<br />
31.9%<br />
Netherlands,<br />
3.6%<br />
Spain, 6.7%<br />
Other EUmember<br />
countries,<br />
13.7%<br />
Germany,<br />
15.0%<br />
Italy, 15.7%<br />
France,<br />
26.6%<br />
United<br />
Kingdom,<br />
18.7%<br />
Glassware,<br />
27.2%<br />
Source: Euromonitor ‘Consumer Europe’, <strong>2003</strong>/04<br />
The French table- & kitchenware <strong>market</strong> is by far the biggest in the EU, totalling to almost € 4.9<br />
billion (excl. metalware and woodware) in 2002. That year the <strong>market</strong> grew by 3.5 percent.<br />
According to Euromonitor, France’s high ranking is due to the importance of long social meals,<br />
combined with a significant national cuisine, meaning that the French table- & kitchenware<br />
<strong>market</strong> is more formal than in other countries. This is reflected in the popularity of formal<br />
dinnerware, like glassware, china and porcelain and cutlery. However, as in the rest of the EU,<br />
the French <strong>market</strong> is steadily shifting to less formal products, such as plasticware, which are<br />
becoming increasingly important.<br />
Plasticware, the biggest segment in France amounted to € 1.7 billion in 2002, representing a 35<br />
percent share of the total French table- & kitchenware <strong>market</strong>. France’s second table- &<br />
kitchenware segment in size, glassware, continued to grow, after being down in 1999 and 2000.<br />
Ceramicware, china and porcelain together accounted for 25 percent of the table- & kitchenware<br />
consumption in 2002.<br />
Cutlery was the star performer in France’s table- & kitchenware <strong>market</strong>. Since 1998, the <strong>market</strong><br />
has grown by more than 20 percent and amounted to a value of € 757 million. The French<br />
metalware <strong>market</strong> is extrapolated at an amount of € 944 million in 2002.<br />
16
Figure 3.4<br />
Value of consumption table- & kitchenware segments per country, 2002, in € million<br />
Netherlands<br />
65<br />
86<br />
126<br />
137<br />
243<br />
Spain<br />
124<br />
180<br />
156<br />
419<br />
352<br />
Germany<br />
336<br />
587<br />
476<br />
517<br />
844<br />
Italy<br />
251<br />
247<br />
429<br />
628<br />
1,318<br />
United Kingdom<br />
172<br />
347<br />
642<br />
572<br />
1,689<br />
France<br />
540<br />
654<br />
757<br />
1,233<br />
1,700<br />
€ - € 200 € 400 € 600 € 800 €<br />
1,000<br />
€<br />
1,200<br />
€<br />
1,400<br />
€<br />
1,600<br />
Plasticware Glassware Ceramicware China & Porcelain Cutlery<br />
€<br />
1,800<br />
Source: Euromonitor, <strong>2003</strong><br />
United Kingdom<br />
The British table- & kitchenware <strong>market</strong> has shown an enormous growth. In the five-year period<br />
between 1998 and 2002, the <strong>market</strong> grew by almost 30 percent. This, however, was mainly<br />
caused by stunning growth in the late nineties. In 2002, the British <strong>market</strong> grew somewhat over 4<br />
percent, to a value of € 3.4 billion The British table- & kitchenware <strong>market</strong> is characterised by a<br />
less formal style than the French or Italian <strong>market</strong>s. The British seem to prefer practicality,<br />
durability and design rather than formal table- & kitchenwares. This is reflected in the popularity<br />
of plasticwares. In 2002, plasticwares accounted for almost 50 percent of the table- &<br />
kitchenware consumption in the UK.<br />
In 2002, the UK’s second segment, ceramicware showed a low growth for the second year in a<br />
row, growing only by 2 percent, to € 642 million. British glassware consumption grew by more<br />
than 4 percent in 2002. In comparison with the EU average, the British glassware <strong>market</strong> is<br />
relatively small in size, as the <strong>market</strong> represented a value of around € 572 million. British<br />
spending on cutlery is relatively small in comparison with other EU countries. In 2002, cutlery<br />
made up only 5 percent of the British table- & kitchenware sales. Despite this small size, cutlery<br />
is one of the best-growing product groups in the British tableware- & kitchenware <strong>market</strong>.<br />
Extrapolations indicate that British metalware consumption is the highest in the EU, amounting to<br />
approximately € 1 billion in 2002, on top of the € 3.4 billion for the other segments.<br />
17
Italy<br />
Italy is the third table- & kitchenware <strong>market</strong> in the EU, representing a value of almost € 2.9<br />
billion. The Italian table- & kitchenware <strong>market</strong>, like the British one, shows a stunning<br />
development over the reviewed period between 1998 and 2002. In that period, the <strong>market</strong> grew<br />
by almost 28 percent. Italy’s high ranking is due to the distinct maturity of Italian table- &<br />
kitchenware <strong>market</strong>. The Italian <strong>market</strong>, like the French <strong>market</strong>, is characterised by higher-priced<br />
formal items. Formal items such as glassware and china are very popular, as can be seen in Figure<br />
3.4. A long tradition of producing designed pieces of table- & kitchenware make Italy an<br />
important table- & kitchenware <strong>market</strong>.<br />
Glassware is by far the most popular product group in Italy. Because of this popularity, the Italian<br />
glassware <strong>market</strong> is the EU’s largest national glassware <strong>market</strong> representing a value of € 1.3<br />
billion in 2002. Between 1998 and 2002, the glassware <strong>market</strong> grew on average 8 percent per<br />
annum. The second segment, ceramicware, grew by 3.5 percent, to a value of € 628 million. In<br />
comparison with the EU average, the Italian plasticware <strong>market</strong> is relatively small. Despite this<br />
small size, it showed a healthy growth in the reviewed period.<br />
Italy is the EU’s second cutlery <strong>market</strong> after France. In 2002, the Italian cutlery <strong>market</strong> showed a<br />
growth for the third year in a row, rising to a value of € 251 million. China and porcelain, Italy’s<br />
smallest table- & kitchenware <strong>market</strong>, showed the highest growth of all the segments reviewed. In<br />
2002, the <strong>market</strong> grew by more than 5 percent, to € 246 million. The Italian metalware <strong>market</strong> is<br />
estimated at a value of € 274 million in 2002.<br />
Germany<br />
The German table- & kitchenware <strong>market</strong> is a major <strong>market</strong>, mainly due to the size of the German<br />
population. According to Euromonitor, the German table- & kitchenware grew in 2002 for the<br />
second year in a row, after being down between 1998 and 2000. In 2002, the <strong>market</strong> grew by<br />
more than 2.5 percent, to almost € 2.8 billion. Over a longer period of time, the German <strong>market</strong><br />
presents the lowest growth of the entire EU, as can be seen in Figure 3.1. Over the review period,<br />
between 1998 and 2002, the <strong>market</strong> grew by less than 2 percent. Like the British, the Germans<br />
consider functionality and price to be more important than decorative aspects of products,<br />
according to Euromonitor. This, together with the informality of the <strong>market</strong> partly explains the<br />
relative low expenditure of the Germans on table- & kitchenwares.<br />
Glassware, the biggest table- & kitchenware segment in Germany, continued its recovery, which<br />
started a year earlier, and in 2002 the <strong>market</strong> reached a value of € 844 million. China & porcelain<br />
is very popular in Germany. The German china & porcelain segment is the largest in the EU. In<br />
2002, this <strong>market</strong> rose to a value of more than € 587 million, putting Germany even ahead of<br />
France.<br />
As in Italy, plasticwares are less popular in Germany. Plasticwares only account for 19 percent of<br />
the total tableware- & kitchenware sales whereas, in the entire EU, plasticware accounts for a<br />
share of 32 percent. Despite its relatively small size, the German plasticware <strong>market</strong> showed a<br />
healthy growth throughout the reviewed period. Cutlery is the smallest table- & kitchenware<br />
segment in Germany, representing a value of € 336 million in 2002. The German metalware<br />
<strong>market</strong> is estimated at a value of approximately € 712 million in 2002.<br />
Spain<br />
The Spanish table- & kitchenware <strong>market</strong> showed a healthy growth in both 2001 and 2002. In<br />
2002, the Spanish table- & kitchenware grew by 5.5 percent, to a value of € 1.2 billion. As in<br />
France and Italy, dining plays an important role in Spanish social life. With a significant national<br />
cuisine, the Spanish table- & kitchenware <strong>market</strong> is more formal in than many other countries in<br />
Western Europe. However, unlike France and Italy, Spain has a no tradition in manufacturing<br />
table- & kitchenware and, perhaps as a result, premium items are less important. According to<br />
Euromonitor, Spanish people favour functionality and durability.<br />
18
Glassware is the largest table- & kitchenware segment in Spain, representing 34 percent of the<br />
total <strong>market</strong>. Spain’s second largest segment is plasticware. This segment showed a healthy<br />
development in 2002, growing by 6 percent in comparison with the preceding year, to almost €<br />
353 million. As in 2001, the Spanish china & porcelain grew by more than 6 percent in 2002, to a<br />
value of € 180 million that year.<br />
In the reviewed period, the Spanish ceramicware <strong>market</strong> showed a healthy growth. Nevertheless,<br />
it remains a relatively small segment in comparison with the EU average. Spain’s smallest table-<br />
& kitchenware segment, cutlery, made up about 10 percent of the Spanish <strong>market</strong>. In 2002, the<br />
<strong>market</strong> grew by 5 percent, to a value of € 124 million. The Spanish metalware <strong>market</strong> is estimated<br />
at a value of € 148 million in 2002.<br />
The Netherlands<br />
According to Euromonitor, the total Dutch table- & kitchenware <strong>market</strong> was worth € 657 million<br />
in 2002. Of the <strong>market</strong>s discussed in this <strong>survey</strong>, the Netherlands showed the largest growth in<br />
2002. Like the UK <strong>market</strong>, the Dutch <strong>market</strong> is characterised by the emphasis on practicality and<br />
durability, rather than formality. This is reflected in the importance of plasticwares. The<br />
plasticware <strong>market</strong> grew by 6 percent, amounting to € 243 million. Glassware, the second<br />
segment in size, is up for the second year in row, after being broadly stable between 1998 and<br />
2000. In 2002, this <strong>market</strong> also grew by 6 percent, to a value of € 137 million.<br />
China & porcelain represent 15 percent of the table- & kitchenware <strong>market</strong> and like the glassware<br />
<strong>market</strong> showed a healthy growth in 2001 and 2002. The same applies to the ceramicware. After<br />
being at a standstill between 1997 and 2000, the <strong>market</strong> grew in 2002 by 6 percent, to a value of €<br />
126 million. The smallest segment, cutlery, grew by 6 percent in 2002, to a value of € 65 million.<br />
Metalware is relatively important in the Netherlands, mainly due to the importance of cookware.<br />
In 2002, the Dutch metalware <strong>market</strong> is extrapolated at a value € 215 million.<br />
3.2 Market segmentation<br />
In this paragraph, we will highlight developments in the different product groups identified in<br />
chapter 1. We will also deal with the differences between the EU countries highlighted in this<br />
<strong>survey</strong>. Furthermore statistical information concerning the consumption per capita is given. The<br />
last part of this paragraph gives a segmentation by different users who can be distinguished in the<br />
table- & kitchenware <strong>market</strong>.<br />
Figure 3.5 Consumer expenditures on<br />
3.2.1 Market segmentation by product<br />
plasticware (per year in € per capita),<br />
in the EU, 1998-2002<br />
Plasticware<br />
Plasticware is the biggest table- &<br />
kitchenware product group in the EU,<br />
amounting to a value of € 5.9 billion in 2002.<br />
In the review period, it also represented the<br />
fastest growth. Between 1998 and 2002, the<br />
EU plasticware <strong>market</strong> grew by almost 25<br />
percent. This success is due to the advantages<br />
of plasticwares, which are cheap, lightweight,<br />
practical and fashionable. The adaptability,<br />
modern design and colours of plasticwares<br />
also attract consumers.<br />
France and the United Kingdom are the two<br />
major plasticware <strong>market</strong>s in the EU, together<br />
accounting for 58 percent of the total<br />
consumption. Figure 3.5, consumer<br />
35<br />
30<br />
25<br />
20<br />
15<br />
10<br />
5<br />
0<br />
28.64 28.34<br />
France<br />
United<br />
Kingdom<br />
15.08<br />
Netherlands<br />
Spain<br />
8.92<br />
Italy<br />
7.41<br />
1998<br />
2000<br />
2002<br />
Germany<br />
6.32<br />
Source: Euromonitor, <strong>2003</strong><br />
Source: Euromonitor, <strong>2003</strong><br />
19
expenditure per capita, reflects the importance of these two countries. As can also be seen, the<br />
southern European countries consume relatively less plasticware than the Northern European<br />
countries.<br />
Benefiting from the advantages of being lightweight and relatively cheap, plasticwares were also<br />
fashionable and suited the trend towards matching kitchen accessories. Attracted by the bright<br />
colours and modern design of plastic products, consumers often made impulse purchases, which<br />
is why a continuous launching of new ranges was essential. In the reviewed period, plasticware<br />
developed a fashionable image.<br />
According to Euromonitor, storage containers account for the largest product category in terms of<br />
value. This is due to the high value per piece and to the fact that manufacturers continue to<br />
develop new uses for their products all the time. Plastic bins and hermetically sealed food<br />
containers are the next most important products. Bin designs have developed from plain models<br />
to pedal bins and bins with flip lids and are available in many sizes and colours. This has resulted<br />
in an increase of use throughout the house, according to Euromonitor.<br />
Food storage containers are typical impulse purchases and, therefore, new models are launched<br />
frequently. The consumer expects that these containers can go from the freezer directly into the<br />
microwave oven for heating. Moreover, they need to be dishwasher-proof, and space saving is<br />
also important in storage. Therefore, manufacturers are developing new products, which are<br />
multi-functional.<br />
Glassware<br />
In 2002, the EU consumption of glassware<br />
represented a value of almost € 5 billion.<br />
Glassware consists of everyday glassware,<br />
includes drinking glasses, glass cookware and<br />
tableware. France, Italy and Germany are the<br />
most important <strong>market</strong>s in size (See Figure<br />
3.4). In per capita terms, Italy and France are<br />
the top glassware buyers in the EU. In 2002,<br />
each Italian spent € 22.80 on glassware. The<br />
German per capita expenditure dropped by 5<br />
percent in the reviewed period.<br />
Figure 3.6<br />
25<br />
20<br />
15<br />
10<br />
22.78<br />
Consumer expenditures on<br />
glassware (per year in € per capita),<br />
in the EU, 1998-2002<br />
20.78<br />
10.59 10.31<br />
9.60<br />
1998<br />
2000<br />
2002<br />
8.54<br />
Drinking glasses can be divided into two<br />
different <strong>market</strong>s: that of everyday glasses for<br />
which the main purchasing criterion is price,<br />
and that of traditional glassware, which is<br />
considered as an investment. The latter is of<br />
high quality, usually purchased as a gift<br />
(especially for weddings) and is a declining<br />
<strong>market</strong>.<br />
5<br />
0<br />
Italy<br />
France<br />
Spain<br />
Germany<br />
United<br />
Kingdom<br />
Netherlands<br />
Source: Euromonitor, <strong>2003</strong><br />
According to Euromonitor, drinking glasses account for the biggest share of the glassware <strong>market</strong><br />
in many of the EU-countries, though there are profound differences between them. In the United<br />
Kingdom, drinkware accounted for two thirds of the glassware <strong>market</strong>. In France, it accounted for<br />
54 percent of the glassware <strong>market</strong>, whereas in Germany, drinking glass only accounts for a<br />
quarter of the total glassware consumption.<br />
In recent years, people’s lifestyles, and their attitudes toward their home have changed.<br />
Consumers in the EU have turned towards a more casual lifestyle. Subsequently, changes in<br />
purchasing habits and consumer habits have also influenced the glassware <strong>market</strong>. Many<br />
consumers nowadays consider glassware a replaceable fashion product. Manufacturers and<br />
20
etailers are aggressively designing new patterns to keep up with this trend. Moreover, the <strong>market</strong><br />
for this type of glass is strongly affected by promotions from companies in the food and wine<br />
sector, who give glasses away free when consumers buy their products. This <strong>market</strong> segment is<br />
growing, because it is influenced by fashion.<br />
Ceramicware<br />
The EU ceramicware segment represented a<br />
value of more than € 3 billion in 2002. France<br />
and the United Kingdom are the leading<br />
consumers of ceramicware. Like glassware<br />
consumption, France’s and Italy’s per capita<br />
expenditure is the highest in the EU. French<br />
consumption recovered slightly in 2002, but it<br />
is still slightly down compared with 1998.<br />
Product designs of ceramic articles tend to be<br />
modern, with a broad spectrum of shapes,<br />
sizes, colours, materials, and innovative<br />
features to meet different <strong>market</strong> segments.<br />
In the EU, due to the increase in the number of<br />
working couples, consumers are inclined to<br />
buy timesaving, easy-to-handle kitchenware.<br />
Figure 3.7<br />
12<br />
10<br />
8<br />
6<br />
4<br />
2<br />
0<br />
Consumer expenditures on<br />
ceramicware (per year in € per<br />
capita), in the EU, 1998-2002<br />
11.02 10.85 10.77<br />
7.83<br />
France<br />
Italy<br />
United<br />
Kingdom<br />
Netherlands<br />
Germany<br />
5.81<br />
1998<br />
2000<br />
2002<br />
Spain<br />
3.96<br />
Source: Euromonitor, <strong>2003</strong><br />
Products that emphasise quick cleaning as well as simplifying the cooking process will be<br />
appealing to consumers. The trend in the ceramic table- & kitchenware <strong>market</strong> is toward<br />
practical, functional, and stylish. White is the dominant colour for ceramics, according to the<br />
Ambiente. It replaces natural shades, particularly in combinations with green, although orange,<br />
lilac/berry shades and ice-blue are strongly represented too. Designs are becoming straighter,<br />
extending as far as rectangular vases and bowls, with voluminous individual pieces also in<br />
fashion in this segment.<br />
China & Porcelain<br />
In 2002, The value of the EU china &<br />
porcelain segment totalled € 2.4 billion. The<br />
leading china & porcelain <strong>market</strong> in the EU is<br />
Germany, followed by France and the United<br />
Kingdom. In per capita terms, the French are<br />
the top china & porcelain buyers in the EU. As<br />
can be seen in the Figure 3.8, the per capita<br />
expenditure of the United Kingdom and Italy<br />
has risen considerably during the reviewed<br />
period. Between 1998 and 2002, their per<br />
capita consumption increased by 28 and 87<br />
percent respectively.<br />
Convenience has become one of the essential<br />
features for the modern consumer. Therefore,<br />
it is essential that manufacturers try to come<br />
up with practical solutions in their products.<br />
Products with rounded corners (easier to<br />
wash) and fewer sharp edges are important for<br />
use in the dishwasher. Moreover, consumers<br />
expect the products to be microwave-proof.<br />
Figure 3.8<br />
10<br />
9<br />
8<br />
7<br />
6<br />
5<br />
4<br />
3<br />
2<br />
1<br />
0<br />
France<br />
9.11<br />
Consumer expenditures on China &<br />
Porcelain (per year in € per capita),<br />
in the EU, 1998-2002<br />
Germany<br />
7.18<br />
5.82<br />
United<br />
Kingdom<br />
Netherlands<br />
5.32<br />
Italy<br />
1998<br />
2000<br />
2002<br />
4.26 4.55<br />
Spain<br />
Source: Euromonitor, <strong>2003</strong><br />
21
White with minimalist lines remains the distinctive feature of porcelain, according the Ambiente.<br />
At the moment, shades of green, lilac-pink and yellow are the most important colours. Luxury is<br />
also becoming more important in this segment.<br />
Cutlery<br />
The EU-cutlery <strong>market</strong> represented a value of over € 2 billion in 2002. France is the EU’s leading<br />
cutlery consumer. In 2002, France accounted for 37 percent of the total cutlery sales in the EU. At<br />
a considerable distance, we find Germany and Italy. Looking at the per capita expenditure, the<br />
French are by far the biggest consumers of cutlery. In 2002, they spent about € 12.76 per capita,<br />
almost three times as much as the Italians.<br />
There are basically two <strong>market</strong>s for cutlery, that of classic high quality cutlery, mostly sold in<br />
sets, and casual cutlery for everyday use, generally sold by piece. Everyday cutlery can itself be<br />
divided into two segments: conventional and fashion-oriented cutlery. Everyday cutlery, in<br />
general, should be inexpensive whereas fashion-oriented pieces can command somewhat higher<br />
prices. A good example of this is cutlery with fashionable coloured handles, which has been<br />
popular for several years following a trend towards matching kitchenware. This type of cutlery,<br />
although also sold by piece, is sometimes presented in simple sets of four or six on a stand. This<br />
type of novelty provides manufacturers and retailers with added-value in a generally low-value<br />
sector.<br />
High-quality cutlery can also be divided into<br />
two segments: stainless steel plated cutlery,<br />
and cutlery made of precious metals, mainly<br />
silver. The top end of the <strong>market</strong> is completely<br />
dominated by famous brands. This type of<br />
cutlery is purchased once in a lifetime and the<br />
purchases are seen as an investment. This<br />
segment however is shrinking, mainly because<br />
of reasonable quality and low prices of the<br />
first segment.<br />
A key development is the popularity of<br />
kitchen knives, which have become<br />
professional-style products. Knife-sets have<br />
become a popular item in the kitchen today.<br />
According to the Ambiente, linear and<br />
functional designs dominate the cutlery<br />
<strong>market</strong>, with stainless steel being the material<br />
of choice. New materials, like titanium are<br />
starting to be used to enhance the appeal.<br />
Figure 3.9<br />
14<br />
12<br />
10<br />
8<br />
6<br />
4<br />
2<br />
0<br />
12.76<br />
France<br />
Consumer expenditures on Cutlery<br />
(per year in € per capita), in the EU,<br />
1998-2002<br />
Italy<br />
4.34 4.1 4.05<br />
Germany<br />
Netherlands<br />
Spain<br />
1998<br />
2000<br />
2002<br />
3.15 2.89<br />
United<br />
Kingdom<br />
Source: Euromonitor, <strong>2003</strong><br />
Metalware<br />
There are no figures available concerning the consumption of metalware in the EU. In the<br />
previous paragraph, we have given some extrapolation concerning the <strong>market</strong> size in the different<br />
countries in this <strong>survey</strong>. The extrapolations indicate that North European countries (United<br />
Kingdom, Germany and the Netherlands) consume relatively more metalwares. This can be<br />
explained by the fact that metal pots and pans are the main food preparing items in these<br />
countries, whereas in Italy and Spain, people use more ceramic and glass cook- and ovenware.<br />
According to Euromonitor, the metalware <strong>market</strong> can be divided into to two segments. Firstly, it<br />
consists of metal products which are more table-orientated, like for example bread-baskets. The<br />
second segment consists of metal products which are used in the preparation of food, like cook-,<br />
oven- and bakeware. This segment accounted for more than three-quarters of the <strong>market</strong> for<br />
metallic table- & kitchenware. The way people prepare their food largely determines the<br />
22
popularity of certain products. Cooking methods using ceramic and induction hobs have<br />
increased at the expense of the traditional gas cooker. These new methods have triggered the<br />
demand for specially adapted pots and pans. In the case of ceramic hobs, which consist of a vitro<br />
ceramic surface heated by radiant or halogenic rings, a very strong heat is given off very quickly<br />
and this can damage ordinary pans. Induction hobs, however, necessitate the use of saucepans<br />
with high magnetic properties.<br />
Hence the increase in demand for pans resistant to all types of heat, and pans specially suited to<br />
vitro-ceramic or induction hobs. The metalware <strong>market</strong> is shifting towards more functional<br />
products which are for all new types of kitchen appliances (such as ceramic and induction hobs<br />
and dishwashers).<br />
In Table 3.1, the penetration of different cooking appliances is reflected. As can be seen,<br />
microwave penetration is very high in most EU-countries. Because of the success of the<br />
microwave, metallic ovenware has lost <strong>market</strong> share to ceramic and glass products which are<br />
better adapted to microwave cooking. The traditional metal kettle is rapidly being replaced by<br />
electric kettles. The advantages of the electric kettle compared to the old kettle are that it is faster,<br />
the quantity of water can be more precisely measured and it can be used in any place where you<br />
have an electric socket.<br />
Table 3.1 Household penetration of cooking appliances by country, 2002<br />
Freestanding Built-inhobs<br />
Ovens Microwaves Fridge Fridge Freezer<br />
Cookers<br />
Freezer<br />
France 50% 38% 36% 74% 96% 52% 55%<br />
Italy 75% 24% 25% 24% 81% 24% 34%<br />
Germany 58% 23% 15% 65% 20% 79% 55%<br />
United Kingdom 60% 40% 40% 77% 60% 40% 45%<br />
Spain 25% 77% 91% 56% 38% 48% 13%<br />
The Netherlands 29% 48% 77% 66% 82% 8% 65%<br />
Source: Euromonitor, 2002<br />
According to Mintel, the cookware <strong>market</strong> is polarised between high-priced premium products<br />
and budget-priced products, mainly imported from low-wage countries in Asia. The main<br />
purchase criteria are reliability, durability and versatility. Manufacturers of cookware apply the<br />
latest technology, focussing on formulating the proper metal chemistry and creating products<br />
which suit consumers’ every demand for stylish products, comfortable handles, etc.<br />
Woodware<br />
In the mid nineties, there seemed to be a growing interest in woodware, which was caused by the<br />
increasing demand for products with a natural look. In the EU, there is a tendency to replace<br />
plastics with wooden products, because of the luxurious and classical look which wood gives to<br />
products. Therefore, wooden table- & kitchenware is often positioned as a fashionable and<br />
decorative gift item. Despite this development, woodware only accounts for approximately 1 to 2<br />
percent of the total table- & kitchenware consumption, according to Euromonitor.<br />
Because of the small size of the <strong>market</strong>, the wooden table- & kitchenwares remains a niche<br />
segment. No major manufacturer is experimenting with wood. Therefore, most products sold in<br />
this segment are private labels. Retailers like Ikea are buying these products from small-scale<br />
craftsmen.<br />
23
3.2.2 Market segmentation by user<br />
In recent years, changes in lifestyle and trends have been occurring faster. Consumer behaviour<br />
has become more impulsive, especially in northern EU countries. Fashion is also an important<br />
indicator for trends in the table- & kitchenware <strong>market</strong>. Segmentation of consumers is becoming<br />
more important. Different styles and designs satisfy different groups. Below we present the major<br />
consumer groups in the table- & kitchenware sector.<br />
• Singles (young) This group consists of students and single-person households. The<br />
people in this group usually live alone; they spend more time out of their homes. They<br />
mostly perceive cooking as a chore. They mainly purchase low-priced table- &<br />
kitchenware which is functional and easy to use.<br />
• Couples (childless) This group consist of couples, where both partners are employed,<br />
resulting in higher spending power. They are increasingly sensitive to fashion and are<br />
more responsive to new and modern design trends. People in this group are important<br />
customers for premium designer table- & kitchenware.<br />
• Couples (parents) This group consist of people with young children. They are<br />
sensitive to fashion, but not as much as childless couples. The parents prefer convenience<br />
and dishwasher-safe, durable products to high-priced elegant items, which may get<br />
broken.<br />
• Older couples (middle-aged) This group consist of somewhat older people (baby<br />
boomers). In most cases, the children have left the house. These middle-aged people<br />
spend most of their leisure time at home, socialising with friends and family. They are<br />
gradually replacing and upgrading their current table- & kitchenware. The people in this<br />
group have high disposable incomes. Value-for-money and functionality are important<br />
purchase criteria’s in this group. They are less sensitive to fashion and mainly purchase<br />
the more traditional table- & kitchenware products.<br />
• Seniors (65+) This is the fastest growing consumer group in the EU-countries. It<br />
consists of retired people. In most cases these seniors move towards smaller houses.<br />
Value-for-money and functionality are important purchase criteria. These people mostly<br />
fancy traditional table- & kitchenware, which they have collected throughout their lives.<br />
• Hobbyists This growing group consists of people all ages. Because of the shift<br />
towards the convenience- and ready-made meals, consumers are freed from the laborious<br />
chore of creating family meals on a daily basis. Because of this development, gourmet<br />
cooking has become an occasional hobby for many people. They often purchase highend,<br />
expensive professional products.<br />
Catering industry<br />
According the Committee of the European Glass Industry, 28% of all glassware is sold to the<br />
catering industry (restaurants, hotels, bars). This shows how important the catering industry is to<br />
the entire table- & kitchenware sector.<br />
Because it uses table- & kitchenware extensively, the catering sector sets high demands on the<br />
quality of the products. Products need to be durable, heat-resistant, chip-resistant, microwaveand<br />
dishwasher-proof and have high hygiene standards. The more traditional table- &<br />
kitchenwares are particularly popular amongst the caterers.<br />
24
3.3 Consumption patterns and trends<br />
The demand for table- & kitchenware is influenced by a number of trends. In the macroenvironmental<br />
analyses in this paragraph, we will discuss these trends. You should, however, take<br />
into account that different developments discussed in this paragraph can relate to each other. For<br />
example, the social trend, “individualization” is closely related to the demographic trend towards<br />
smaller households. It is, therefore, important to determine to what extent these developments<br />
apply to your company and the product range you offer. This paragraph reviews the following<br />
trends:<br />
• Demographic trends<br />
• Social & cultural trends<br />
• Technical trends<br />
• Economic trends<br />
3.3.1 Demographic trends<br />
Germany with 83 million inhabitants is by far the largest country in the EU, followed by the UK<br />
(60 million), France (60 million) and Italy (58 million). Spain and the Netherlands are the two<br />
smaller countries discussed in this <strong>survey</strong> accounting for 40 and 16 million inhabitants<br />
respectively. According to Eurostat, the EU has approximately 379.6 residents. This number<br />
however will increase with the entrance of ten new countries in 2004, the so-called “accession<br />
countries”, Poland, Lithuania, Estonia, Latvia, Hungary, the Czech Republic, Slovenia, Slovakia,<br />
Malta and Cyprus. As a result of this enlargement, the EU will expand to 25 countries, with a<br />
total of 450 million residents.<br />
Structure<br />
The age structure of the population and, more significantly, the number of households, the lifestage<br />
of these households and marriage rates are basic demographic determinants of the levels of<br />
expenditure on table- & kitchenware. According to Eurostat, the EU population grew by 0.4<br />
percent to a total of 379.6 million inhabitants in 2002. The EU is expected to grow for about 20<br />
years from now, on basis of present trends in fertility, mortality and international migration. The<br />
population is likely to peak in 2025 at approximately 385 million inhabitants (excluding the<br />
“accession” countries) and then return in 2050 to a level close to the present figure.<br />
Household formation<br />
New household formation, which is an important engine for growth in the table- & kitchenware<br />
<strong>market</strong>, is not expected to rise substantially in the near future. In 2001, there were approximately<br />
153 million households in the EU. In the five-year period between 1997 and 2001, the number of<br />
households in the EU-member countries only increased by 0.8 percent annually. The composition<br />
of these households is also steadily shifting. Through developments like ‘dilution’, family<br />
households are getting smaller because of the simple fact of people are having fewer children.<br />
Also the growing divorce rates and the dropping marriage rates have a positive effect on the<br />
number of households in the EU. The average EU household is getting smaller. In 1991 a<br />
household consisted of on average 2.6 persons, in 2001, this rate dropped to 2.4 persons per<br />
household (Eurostat).<br />
Ageing population<br />
The composition of the population is changing. Europe is entering a period of accelerated<br />
population ageing. This phenomenon will extend to the majority of the EU-countries. The<br />
younger generation, the 0-24 age group, representing 31 percent of the population in 1995, will<br />
fall to 27 percent in 2015, a decline of 11 million. In some regions in Germany, Italy, Spain and<br />
France, the younger generation will represent less than 25 per cent. The retired generation (65+)<br />
will increase, significantly and unevenly throughout Europe. In 2050, we can expect 28 percent of<br />
the total European population, including Russia, to be aged 65 and over, as compared to 14<br />
percent today.<br />
25
These developments have both a negative and a positive effect on the table- & kitchenware sales.<br />
The <strong>market</strong> for basic products like pans, gadgets, etc. is growing because of the steadily<br />
increasing number of households. On the downside, these smaller households do not need the<br />
large table- & kitchenware sets often sold in the premium-end of the <strong>market</strong>.<br />
Marriage rates & timing<br />
According to Euromonitor, the number of marriages is an important sales driver in the table- &<br />
kitchenware <strong>market</strong> especially in the premium-end of the <strong>market</strong>. Traditionally table- &<br />
kitchenwares make up a substantial share of the wedding gifts given.<br />
The marriage rate in the EU is steadily dropping. Pre-marriage households are very common.<br />
According to Eurostat, the EU marriage rate dropped from an average of 6.3 marriages per 1000<br />
inhabitants in 1980, to 5.1 marriages in 2002. Many people today choose to delay their marriage<br />
until they are somewhat older. This development has some implications, especially for the<br />
premium table- & kitchenware segment, as for example crockery sets and crystalware. Because of<br />
this development, couples each tend to have well-equipped homes, making wedding gifts of<br />
table- & kitchenware redundant.<br />
3.3.2 Social & cultural trends<br />
There are significant changes in consumption habits in the varying EU-countries, due to<br />
improvement of life, and differences in culture, traditions and tastes. In this section, the main<br />
social trends which influence the consumption of table- & kitchenware will be discussed.<br />
Turning inwards<br />
According to the Ambiente, a slumbering economy turns consumers more inwards to their homes<br />
and kitchens. Consumers are spending more time on social events at home like dining, playing<br />
games, etc., with family and friends, combined with the rise of in-home entertainment systems,<br />
which are good and cheap alternatives of out-of-home possibilities. This phenomenon of<br />
”staying-in”, according to Global Information Inc., has a positive effect on table- & kitchenware<br />
sales.<br />
From formal to casual<br />
Another important development is the shift from formal to more casual everyday table- &<br />
kitchenware. According to Unity Marketing, today’s consumers more often buy this casual<br />
everyday table- & kitchenware rather than the higher-priced formal tableware which is the<br />
traditional cornerstone of the industry. Other relevant social trends are discussed below.<br />
Changing eating and cooking habits<br />
As mentioned earlier, the EU consumption of table- & kitchenware is steadily shifting away from<br />
formal products towards more practical and informal products. According to Euromonitor, the<br />
busier lifestyles, the increasing number of single-person households and a growing number of<br />
working women, lead to changing lifestyles. Family meals are being replaced by “grazing”, as<br />
consumers eat more easy-to-prepare snacks during the day rather than a formal meal. This trend is<br />
more pronounced in the Western countries of Europe. However, even in countries with a<br />
significant, traditional dining culture, like Italy and France, this trend is also evident. The<br />
tradition of long, extensive meals is being replaced by convenient, ready-made meals, which take<br />
less time to prepare.<br />
There is also a growing trend towards health and wellbeing. Today’s stressful society has a<br />
positive effect on the sales of health-related products. Fat-free or low-fat products are very<br />
popular throughout many food product ranges. In the table- & kitchenware <strong>market</strong>, this trend has<br />
a significant impact on food preparation methods. Low fat or even fat free cooking methods, like<br />
for example steaming, increasingly substitute less healthy cooking methods like frying and<br />
roasting. Low-fat cookware like grills, steamers and woks has become more popular in the<br />
reviewed period.<br />
26
Social diversity<br />
The modern consumer can no longer be clearly defined. Consumers are becoming more diverse<br />
both in social and in cultural terms. This is due to a number of developments. First, ageing and<br />
increasing life spans lead to a greater diversity of ages. Secondly, growing immigration,<br />
combined with growing tourism and the better availability of foreign spices and herbs, bring a<br />
greater variety in cooking and eating habits. According to Eurostat, migration made up three<br />
quarters of the total EU population increase in 2001. These developments are for example,<br />
reflected in the popularity of the oriental cuisine. According to Key Note, the popularity of ethnic<br />
dishes has led to increased demand for cooking and eating utensils such as woks.<br />
In the EU today, an increasing number of women have jobs of their own. This development has<br />
led to the growing importance of women as consumers. This increase, however also meant that<br />
the time to cook is often in short supply. Leisure time is too highly valued to spend on cooking,<br />
especially when the additional income can be spent on ready-made meals or on eating out. This<br />
development has also had some implications on table- & kitchenware sales, particularly on the<br />
demand for easy-to-handle utility products, which are microwave and dishwasher-proof, which<br />
have grown.<br />
Figure 3.10 Trickle-down effect design trends<br />
Fashion<br />
Because of the shift towards more casual products,<br />
table- & kitchenwares are increasingly influenced<br />
by fashion developments. According to sources at<br />
the Birmingham Autumn Fair, trends in the table-<br />
& kitchenware <strong>market</strong> are likely to change<br />
significantlly every twelve to eighteen months.<br />
According to Euromonitor, fashion has a major<br />
influence on table- & kitchenwares, especially in<br />
ceramicware, china and porcelain segments.<br />
However, the other segments are also becoming<br />
much more fashion-orientated. The increasing<br />
importance of design has been stimulated by the<br />
growing popularity of DIY and home makeover<br />
programmes, which have increased the<br />
popularity of interior design.<br />
Architecture<br />
Fashion<br />
Home textile<br />
Table- &<br />
kitchenware<br />
Lifestyle<br />
Source: Euromonitor, 2000<br />
In general, fashion in the table- & kitchenware <strong>market</strong> is influenced by several trends. In terms of<br />
colour, trends generally begin in women’s fashion and extend themselves via men’s fashion into<br />
home textiles, and into DIY products. From here, the influence impacts the table- &<br />
kitchenwares. For more information on trends and colours, please refer to CBI’s “Colour trends<br />
2004/06”.<br />
According to Euromonitor, shape is influenced by architecture, especially at the premium-end of<br />
the <strong>market</strong>. On the practical and functional side of the <strong>market</strong>, shape is influenced by lifestyle<br />
trends.<br />
The ageing society has also triggered the demand for light-weight, ergonomically designed<br />
utensils, gadgets and pan handles.<br />
27
Hobby Cooking<br />
The growing trend towards more practical and more functional table- & kitchenware does not<br />
mean that the consumer is not interested in food or food preparation. On the contrary, the<br />
popularity of TV cooking shows and interest in cooking magazines have increased, exposing<br />
consumers to a wide variety of cuisines, table- & kitchenwares and cooking techniques, and<br />
prodding them to purchase and try these new techniques and products. The number of cooking<br />
classes has also increased in recent years and consumers try to recreate the ambiance of expensive<br />
restaurants when enjoying home-cooked meals. According to Euromonitor, this was a result of<br />
the shift towards convenient and ready-made meals. Consumers were freed from the laborious<br />
chores of creating family meals on a daily basis and, because of this development, extensive<br />
cooking, for many people, has come to be seen as an hobby or leisure-time activity.<br />
Brand awareness<br />
EU consumers are generally not very familiar with the different brands of table-kitchenware.<br />
Most consumers do not believe that famous brands automatically mean better quality and the<br />
average consumer is not well-informed about the different brands of table- & kitchenware<br />
manufacturers. Brand awareness however, differs per product group. In the ceramicware, china &<br />
porcelain and metalware sectors, brand awareness is generally higher than in the other segments,<br />
mainly due to the <strong>market</strong>ing efforts of the manufacturers in these sectors.<br />
3.3.3 Technical trends<br />
The busy lifestyles and the trend away from<br />
family meals, together with the increasing<br />
popularity of microwaves and dishwashers,<br />
have triggered demand for easy-to-use<br />
products adapted for use in these appliances.<br />
In <strong>2003</strong>, around 35 percent of European<br />
households will own a microwave. Products<br />
which can be heated up at different times for<br />
individual family member are characteristic<br />
of the new eating habits. Convenience and<br />
functionality are becoming increasingly<br />
important throughout Europe. According to<br />
Key Note, the popularity of microwaves has<br />
led to the introduction of plasticwares<br />
specifically designed for microwave cooking.<br />
Table 3.2<br />
Household penetration of dishwashers<br />
and Microwaves by country, 2002<br />
Dishwasher Microwave<br />
France 45% 74%<br />
Italy 39% 24%<br />
Germany 56% 65%<br />
United Kingdom 25% 77%<br />
Spain 22% 56%<br />
Netherlands 55% 66%<br />
Source: Euromonitor, 2002<br />
New products & innovation<br />
New materials and technical innovations are also very important for table- & kitchenware sales.<br />
According to sources on the Ambiente, consumers, due to the uncertain economic climate, are<br />
more conservative in their spending. Replacement sales are not very popular in these slow<br />
economic times. However, new products with new features and designs trigger the consumers to<br />
purchase.<br />
3.4.4 Economic trends<br />
Economic growth has slowed across much of Western Europe since the turn of the millennium,<br />
with the softness in the economy driven for a large part by cyclical trends, such as reduced<br />
exports amid global weakness. Reduced consumer confidence and growth in unemployment<br />
were, among others, the main factors leading to a smaller growth in total consumer spending.<br />
However, it looks as if table- & kitchenware consumption has not been greatly affected by this<br />
development, as can be seen in paragraph 3.1. This can partly be explained by fact that, due to the<br />
slow economy, consumers have turned more inwards to their homes and kitchens (see Paragraph<br />
3.4.2) (Source: Ambiente).<br />
28
4 PRODUCTION<br />
Over the last decade, the table- & kitchenware <strong>market</strong> has become increasingly competitive,<br />
mainly due to the pressure of low-cost imports deriving from Asia and Eastern Europe. The more<br />
expensive labour force and the stricter regulations in the EU Countries, have made it difficult for<br />
EU manufacturers to compete. Because of this increasing competition, many EU manufacturers<br />
tried to position themselves at the premium-end of the <strong>market</strong>, where the margins are better<br />
(Source Euromonitor). However, because of this development, the segment became crowded.<br />
Combined with the <strong>market</strong> saturation, especially in Western Europe, and with the <strong>market</strong> shifting<br />
away from traditional formal products towards more functional, quality products, the EU table- &<br />
kitchenware <strong>market</strong> has become a highly competitive place.<br />
The increasing rivalry in other sectors, especially the food retail sector has also contributed to the<br />
increasing competition in the table- & kitchenware <strong>market</strong>. Because of the relatively high margins<br />
and the need to create more “traffic”, an increasing share of retailers, like grocery multiples and<br />
discounters started selling table- & kitchenwares, mainly low-priced products, often “privatelabel”,<br />
deriving from Asia. This development in turn undermined the position of the EU<br />
manufacturers, which were mostly located at the premium-end of the <strong>market</strong>.<br />
To cope with the increasing competition, several EU table- & kitchen manufacturers established<br />
manufacturing bases in Asia, especially in China, Taiwan and Thailand Here, they could combine<br />
their state-of-the-art technology with a low cost-base. In this way, they could maintain an<br />
efficient, high-quality production system but at low cost.<br />
Another answer to the increasing competitiveness was to achieve “economics of scale”. Mergers<br />
and acquisitions were a popular means to acquire the scale necessary to survive in the globalizing<br />
world. Small companies with insufficient production were taken over. This provided an ideal way<br />
for the bigger companies to increase their <strong>market</strong> share in the mature EU table- & kitchenware<br />
<strong>market</strong>. Outsourcing was/is also a popular means for Western manufacturers to remain<br />
competitive. Outsourcing a part of their production to cheap(er) contract manufacturers, offers the<br />
EU manufacturers the chance to focus their attention on <strong>market</strong>ing their products. As can be seen<br />
in Chapter 3, brand awareness in the table- & kitchenware <strong>market</strong> is generally low, however this<br />
is changing. Because of the increasing competition, manufacturers are searching for ways to<br />
differentiate their products from their competitors’. Branding, together with advertisement, is an<br />
important way of achieving this.<br />
Unfortunately, exact figures concerning outsourcing are not available. However, the increasing<br />
importance of especially Asia (See Paragraph 5.3), as a manufacturer of table- & kitchenwares<br />
shed some light on importance of this development. Waterford/Wegdwood an important<br />
European manufacturer of table- & kitchenwares outsources approximately one-third of its<br />
production to European and Asian contract manufacturers.<br />
Another notable development is brand extension; Waterford/Wegdwood for example extended<br />
their product line into linens, jewellery, writing instruments and other giftware.<br />
The production figures given in Table 4.1 are based on calculations made using the consumption<br />
statistics from Euromonitor and the import and export statistics from Eurostat. Therefore, extreme<br />
care must be taken in the qualitative use and interpretation of this information. These figures<br />
however, can give a useful insight in the production size of the countries listed.<br />
29
Table 4.1 Production of the table- & kitchenware segments by country in 2001, in € millions<br />
Metalware Plasticware Glassware Ceramicware China & Cutlery<br />
Porcelain<br />
France 998 1,561 1,966 594 545 718<br />
United Kingdom 734 1,437 362 690 419 58<br />
Italy 860 405 1,503 754 167 251<br />
Germany 518 261 889 414 709 294<br />
Spain 107 334 391 127 106 89<br />
Netherlands 128 30 127 73 79 29<br />
Sources: Euromonitor & Eurostat, 2002/ <strong>2003</strong><br />
4.1 Production per product segment<br />
Many manufacturers involved in the table- & kitchenware <strong>market</strong> are tightly focused on one<br />
product or material type, such as glassware, ceramicware, metalware, cutlery etc. (Source:<br />
Euromonitor). This, however, is steadily changing because of the developments mentioned<br />
earlier. Manufacturers are starting to examine <strong>market</strong>s beyond their original scope. In order to<br />
give a well-organized overview of the EU manufacturers, we have chosen to segment by product<br />
segment.<br />
Metalware<br />
The production of metalware continues to polarise between high-priced premium products and<br />
budget-priced products, mainly imported from low-wage economies in the Far East. Because the<br />
metalware <strong>market</strong>, like the other table- & kitchenware segments, is consolidating, branding has<br />
become more important. At the time of writing, large companies, like the French SEB, with wellknown<br />
brands dominate the EU metalware <strong>market</strong>, especially for metal cookware. The SEB<br />
Group is present in more than 120 countries and produces around 130 million items yearly,<br />
making it one of the world leaders in small domestic equipment. Its brand portfolio contains wellknown<br />
names like Tefal and Rowenta.<br />
Table 4.2 Main manufactures of metalware in the EU<br />
Manufacturer Brands Origin<br />
Seb group Tefal, Arno, Calor, Rowenta, Krups, Seb France<br />
Wmf Wmf, Silit Germany<br />
Le Cr<strong>eu</strong>set Le Cr<strong>eu</strong>set France<br />
Fissler gmbh Fissler, Genovis, Protectal, Magic Line, Magic Edition Germany<br />
Albert spa Albert, Broggi, Facix Italy<br />
B.V. Koninklijke van Kempen & Bk, Keltum, Gero, Q-Linair, Kempen & Begeer, Royal Vkb Netherlands<br />
Begeer<br />
As can be seen in paragraph 5.2, the EU manufacturers are increasingly coming under pressure<br />
from foreign manufacturers. However, manufacturers in France, Germany and Italy are still the<br />
main manufacturers of metalware. There are several reasons for this. First, the EU manufacturers<br />
are strong in terms of innovation and design, and have a thorough knowledge of their home<br />
<strong>market</strong>, which makes it difficult for foreign manufacturers to gain a strong position in the EU<br />
<strong>market</strong>. Secondly, producing metalware, especially cookware, requires highly skilled and<br />
complicated production processes, something which the EU manufactures have years of<br />
experience in.<br />
Plasticware<br />
The most important plasticware-producing countries in the EU are Germany, Italy, United<br />
Kingdom and France. The important position of France in Table 4.1 is highly questionable.<br />
Unlike the other table- & kitchenware segments, the EU manufactures have a strong position on<br />
the EU <strong>market</strong>, mainly because the <strong>market</strong> is dominated by a small number of manufacturers,<br />
who have retained “economics of scale”. The size and the efficiency of their production has made<br />
it possible to hold down prices. Combined with the fact that plasticwares produced by EU<br />
manufacturers or other Western manufactures are strong in terms of innovation, quality and<br />
design, therefore it is difficult for foreign manufacturers to position themselves in the EU.<br />
30
The EU plasticware <strong>market</strong> is dominated by companies like Addis and the American Newell<br />
Rubbermaid. The latter, Newell Rubbermaid, acquired Rubbermaid, a leading EU manufacturer,<br />
in 2001. Due to this takeover, Newell Rubbermaid retained a dominant position in the EU<br />
plasticware <strong>market</strong>, with an extensive product range including storage containers, drainers, boxes,<br />
etc. Newell Rubbermaid’s brand portfolio includes well-known names like Rubbermaid, Curver,<br />
Little Tikes, Graco and Century.<br />
Table 4.3 Main manufacturers of plasticware in the EU<br />
Manufacturer Brands Origin<br />
Newell-Rubbermaid Rubbermaid, Curver, Little Tikes, Graco and Century US<br />
Addis Houseware Ltd Emsa, Addis Germany<br />
Allinox International Ltd Brabantia US<br />
In 1999, the leading British supplier of plasticware, Addis, merged with the German EMSA into<br />
EMSA Holding AG. This merger created one of the biggest EU plasticware manufacturers,<br />
combining numerous household products for everyday use. Due to these takeovers and merges,<br />
the plasticware sector has become increasingly competitive. According to Euromonitor, this<br />
increasing competition will lead to a high degree of activity, in terms of new product launches<br />
and designs, and in terms of price competition.<br />
Glassware<br />
The production of glasswares for table and kitchen usages is one of the smallest sectors of the<br />
glass industry, accounting for approximately 4% of total glass output. Glassware covers the<br />
production of glass tableware, cookware and decorative items, which include drinking glasses,<br />
cups, bowls, plates, cookware, vases and ornaments. According to the Committee of the European<br />
Glass Industry, the EU manufacturers of glassware are widely distributed across the EU, with a<br />
total of 140 installations, producing 996,760 tons of glassware. 72% of glassware sales depend on<br />
private consumption. The remaining share is sold to caterers, restaurants, hotels, bars etc.<br />
The main threat to the EU glassware manufacturers is the increasing competition in the domestic<br />
<strong>market</strong>s from imports deriving from Asia and Eastern Europe, and greater competition in<br />
important export <strong>market</strong>s like Japan and the United States. This increased competition has led to<br />
severe pressure on prices and therefore restricted profitability.<br />
In general, EU glassware manufacturers are noted for their excellent styling and high product<br />
quality standards. France, EU’s most important production country, produced 477,000 tons in<br />
2002. French glassware is known throughout the world as among the finest glassware products<br />
anywhere. French glassware manufacturers have the world’s largest mass production<br />
infrastructure for both fine crystal and soda glass products. France is also home to the world<br />
leading glassware manufacturer Arc International; widely known from brands like: Luminarc,<br />
Crystal d’Arques, Salviata and Arcoroc. Arc International is <strong>market</strong> leader both in France and in<br />
the United Kingdom.<br />
Table 4.4 Main manufacturers of glassware in the EU<br />
Manufacturer Brands Origin<br />
Arc International Group Luminarc, Crystal d’Arques, Salviata, Arcoroc France<br />
Cristalleria Artistica La Piana SpA Royal Cristal Rock (RCR), Primavera di Cristallo, Da Vinci Italy<br />
Crystal and Capri Crystal<br />
F.X. Nachtmann GmbH Nachtmann, Marc Aurel, Spiegelau Germany<br />
Waterford Wedgwood Plc Waterford Crystal Ireland<br />
Glaskoch Glashütten B: Koch Leonardo, Montana<br />
Germany<br />
GmbH<br />
Italy is Europe’s second manufacturer of glassware with a production of 174,000 tons. Through<br />
the reviewed period, the Italian production of mechanically-made glassware fell, but handmade<br />
glassware however, is still significant. Italian mass-<strong>market</strong> soda glass products are known for<br />
31
their distinctive styling. Cristalleria Artistica La Piana SpA (C.A.L.P.) is the leading glassware<br />
manufacturer in Italy.<br />
Germany is Europe’s third manufacturer of glassware. In 2002, Germany produced about 145,000<br />
tons of glassware. Germany’s production mostly employs simple styling and is price-competitive.<br />
Main German manufacturers are Nachtmann, WMF, Villeroy & Boch and Glaskoch. The latter is,<br />
according to Euromonitor, <strong>market</strong> leader in Germany.<br />
Ceramicware, China & Porcelain<br />
The ceramicware and china & porcelain industries are closely related to one another. In the EU,<br />
this sector is dominated by small and medium-sized enterprises. There are, however, some large<br />
manufacturers, like for example Villeroy & Boch, Royal Doulton Limited and Waterford-<br />
Wedgwood, which is probably one of the largest manufacturers in the world. According to<br />
estimates made by Cerame-Unie, the European ceramics sector records total sales of around € 2.7<br />
billion of ceramicware, china & porcelain (this figures includes ornamental ware). Because the<br />
production of ceramics is fairly labour-intensive, the EU ceramicware sector is susceptible to the<br />
effects of competition, especially from low-wage countries in Asia and Eastern Europe. To cope<br />
with the fierce competition, many EU manufacturers have shifted their production, or part of it, to<br />
so-called low-wage countries. Despite these negative developments, EU manufacturers still<br />
dominate the ceramic <strong>market</strong>, because of their <strong>market</strong>ing efforts to create strong brands. The<br />
range of products they produce is vast; products differ greatly between manufacturers and depend<br />
to a large extent on public taste and disposable income.<br />
Table 4.5: Main manufacturers of ceramicware in the EU<br />
Manufacturer Brands Origin<br />
Waterford Wedgwood Plc Rosenthal, Wegdwood, Johnson Bros, Mason’s Ironstone Ireland<br />
Royal Doulton Limited Minton, Royal Doulton, Royal Albert and Enchantica United Kingdom<br />
Villeroy & Boch AG Villeroy & Boch Germany<br />
Royal Copenhagen Royal Copenhagen Denmark<br />
Richard Ginori 1735 Richard Ginori Italy<br />
According to Cerame-Unie, Germany, United Kingdom, France and Italy are the main producing<br />
countries. Germany is especially noted for its high technical skills of white porcelain. Important<br />
German manufacturers are Villeroy & Boch and Rosenthal, the latter majority -owned by<br />
Waterford/Wegdwood Plc. Rosenthal is <strong>market</strong> leader in Germany, Austria and Switzerland for<br />
luxury tableware and avant-garde tabletop design. The United Kingdom is the leading<br />
manufacturer of high-quality bone china and other fine ceramics. Other producing countries are<br />
France and Portugal. Especially in Portugal, production is fragmented and dominated by small<br />
manufacturers and artisans.<br />
Cutlery<br />
Within the EU, Germany, France and Italy are the leading cutlery-manufacturing countries. In the<br />
last decade, the EU cutlery sector has undergone major changes and attracted new global<br />
competitors. Famous companies disappeared, if their management did not embrace new<br />
technology and processes necessary to stay competitive. For this reason, Sheffield, England, is no<br />
longer a leading cutlery centre. Most EU manufacturers underwent massive modernization to<br />
keep up with the increasing competition from Asian countries. EU production is increasingly<br />
focused on premium-end products, including both traditional and design-led cutlery. This<br />
however, has produced only mixed success.<br />
Table 4.6 Main manufacturers of cutlery in the EU<br />
Manufacturer Brands Origin<br />
Albert SPA Broggi, Albert, Facix Italy<br />
Fissler GmbH Magic Germany<br />
Table de France Guy Degrenne, George Butler of Sheffield France<br />
Le Cr<strong>eu</strong>set Le Cr<strong>eu</strong>set France<br />
Zwilling J.A. Henckels AG Zwilling J.A. henckels and J.A. henckels international Germany<br />
WMF WMF Germany<br />
32
In contrast to the metalware sector, brand awareness in the cutlery sector is low. Many<br />
manufacturers use the company name, which mostly acts as an umbrella brand. This low brand<br />
awareness is a major cause of the lack of success of EU manufacturers.<br />
Woodware<br />
As can be seen in the previous chapter, the woodware sector is very small segment in the EU<br />
table- & kitchenware <strong>market</strong>. At the moment, no major manufacturer is active in the production<br />
of wooden table- & kitchenwares and wooden products are generally sold under private-label<br />
brand names. Major retailers like Ikea sell wooden table- & kitchenware, for example chopping<br />
boards, under private label. These products are mostly made by small manufacturers. East<br />
European countries like Poland, Czech Republic and Hungary are also important production<br />
countries. These countries enjoy short transport distances to the EU <strong>market</strong>s, enabling them to<br />
produce at competitive prices. Furthermore, they have a suitable supply of hardwood.<br />
33
5 IMPORTS<br />
Trade statistics given in this chapter and in Chapter 6, derive from Eurostat, which bases its<br />
statistics on information from the Customs and EU companies. Especially in the case of intra-EU<br />
trade, not all transactions are registered, such as those made by smaller companies and<br />
transactions from non-EU sources (see remarks on trade statistics in Chapter 2). On the other<br />
hand, figures for trade between the EU and the rest of the world (Extra-EU) are accurately<br />
registered and are, therefore, more precisely represented in these statistics. Nevertheless, these<br />
statistics must be treated with extreme caution and are only intended to give an indication of trade<br />
flows in the international table- & kitchenware <strong>market</strong>.<br />
The statistics specify total imports, divided into volumes/values, sourced from other EU-countries<br />
(Intra-EU), non-EU-countries (extra-EU) with the values/ volumes coming from developing<br />
countries. The developing countries are defined by the OECD (Organisation for Economic Cooperation<br />
and Development) and are listed in Appendix 5. Appendix 2 lists import statistics of the<br />
EU and the selected <strong>market</strong>s within the EU, and gives a breakdown of the EU imports by product<br />
group.<br />
5.1 Total import<br />
In 2001, the total import of table- & kitchenware was € 8.4 billion, indicating a small decrease of<br />
1 percent in comparison with 2000. In the years preceding 2001, the EU import showed a healthy<br />
development. In the period between 1997 and 2000, EU imports grew in terms of value, on<br />
average, about 5 percent annually. Apparently, the stagnation of the economy in 2001 has slightly<br />
influenced the import of table- & kitchenware. The EU import of table- & kitchenware in terms<br />
of volume was estimated at about € 2.5 million tons in 2001.<br />
Figure 5.1<br />
Total imports of table- & kitchenware into the EU, 1999-2001, in € millions<br />
2,000<br />
1,800<br />
1,600<br />
1,400<br />
1,200<br />
1,829<br />
1,410<br />
1,157<br />
1999<br />
2000<br />
2001<br />
1,000<br />
800<br />
600<br />
400<br />
200<br />
695<br />
624<br />
554 548<br />
437<br />
254 238<br />
178 147 150<br />
101<br />
48<br />
-<br />
Germany<br />
United Kingdom<br />
France<br />
Italy<br />
Netherlands<br />
Spain<br />
Belgium<br />
Austria<br />
Denmark<br />
Sweden<br />
Greece<br />
Ireland<br />
Portugal<br />
Finland<br />
Luembourg<br />
Source: Eurostat, 2002<br />
34
Looking at the Eurostat statistics at a national level, we see significant differences between the<br />
EU countries. Imports by the United Kingdom grew by 8 percent in 2001, German imports, on<br />
the other hand dropped by 8 percent that same year.<br />
Germany is the largest table- & kitchenware import <strong>market</strong>, with an import value exceeding € 1.8<br />
billion in 2001, although, the German share is dropping, they still accounted for almost 22 percent<br />
of the total EU imports. The EU’s second import <strong>market</strong>, the United Kingdom is rapidly gaining<br />
importance at the expense of Germany. The British import share rose from 11 percent in 1992 to<br />
17 percent in 2001. France with a share of 14 percent is Europe’s third importer, followed by<br />
Italy (8%), The Netherlands (8%), Spain (7%) and Belgium (7%) at considerable distance.<br />
Metalware is the biggest product group<br />
imported by the EU countries. In 2001, the<br />
import of metalware totalled € 2 billion,<br />
representing almost a quarter of the total EU<br />
import. Glassware, the second import<br />
<strong>market</strong> dropped by 2 percent in value,<br />
amounting to € 1.9 billion in 2001. The third<br />
import <strong>market</strong>, plasticware, grew by 2<br />
percent in terms of value in 2001<br />
The cutlery import showed an interesting<br />
development. Between 1992 and 2001, the<br />
imported volume showed a higher growth<br />
rate than the value. This would indicate that<br />
the average product prices of cutlery are<br />
dropping.<br />
Figure 5.2<br />
Ceramicware<br />
7%<br />
Porcelain &<br />
China<br />
10%<br />
Cutlery<br />
11%<br />
Import of table- & kitchenware in the<br />
EU, in 2001 by product group, % of<br />
total value<br />
Glassware<br />
22%<br />
Woodware<br />
2%<br />
Metalware<br />
24%<br />
Plasticware<br />
24%<br />
Source: Eurostat, 2002<br />
Origin of the imports<br />
Looking at the origin of the imported table- & kitchenware, we can see that the intra-EU trade is<br />
declining. In 1992, the EU countries still accounted for 66 percent of the EU import in terms of<br />
value. In 2001, this percentage dropped to 52 percent. The main intra-EU suppliers are Italy,<br />
France, and Germany, with shares of 10%, 9% and 9% respectively in terms of value. However,<br />
the picture looks different in terms of volume: here, with a share of more than 15 percent, Italy is<br />
the undisputed <strong>market</strong> leader ahead of France (9%), followed by Germany (7%). The drop in the<br />
intra-EU trade is mainly caused by the increasing competition from cheap-labour countries in<br />
Asia and Eastern Europe. Notably, the importance of China grew explosively the last decade.<br />
35
France<br />
In 2001, the French import of table- &<br />
kitchenware remained stable, representing a<br />
value of € 1.2 billion and a volume of<br />
376,000 tons. Over the five-year period<br />
between 1997 and 2001, the import of table-<br />
& kitchenware showed a healthy growth of<br />
28 percent in terms of volume.<br />
Plasticware, the biggest product group<br />
imported by France, grew by 32 percent<br />
annually in the five-year period between<br />
1997 and 2001. In 2001, the import of the<br />
second largest product group, metalware<br />
remained rather stable both in terms of value<br />
and in terms of volume. As can be seen in<br />
Figure 5.3, the growth of glassware imports<br />
tempered in 2001 in comparison with 1999<br />
and 2000.<br />
Figure 5.3<br />
350<br />
300<br />
250<br />
200<br />
150<br />
100<br />
50<br />
-<br />
323<br />
Plasticware<br />
Imports of table- & kitchenware into<br />
France by product group, 1999-2001<br />
in € millions<br />
267<br />
Metalware<br />
223<br />
Glassware<br />
111 107 100<br />
Ceramicware<br />
Porcelain & China<br />
Cutlery<br />
1999<br />
2000<br />
2001<br />
Woodware<br />
25<br />
Source: Eurostat, 2002<br />
The import of ceramicware showed an interesting development between 1997 and 2001; the<br />
volume increased by 28 percent, but the value only grew by 10 percent. This development<br />
indicated that the average price showed a downwards tendency. The porcelain and china import<br />
remained rather stable in 2001. Over a longer period, however, this import <strong>market</strong> has shown a<br />
positive development. The French import of cutlery showed enormous fluctuations in the<br />
reviewed period. In 2000, the import grew by almost 16 percent. In 2001 however, the import<br />
dropped by 12 percent in terms of value.<br />
Of the countries discussed in this <strong>survey</strong>, France imports the most from within the EU but, like<br />
the other countries discussed in this <strong>survey</strong>, the share of intra-EU trade has slowly declined in the<br />
reviewed period. In 2001 however, the intra-EU trade slightly gained importance, that year<br />
France imported 66 percent of its imported table- & kitchenware from EU-countries. Within the<br />
EU, Italy (18%) and Austria (15%) are France’s main suppliers. Regarding the extra-EU trade<br />
China (12%), Turkey (2%) and Poland (2%) are France’s main suppliers.<br />
United Kingdom<br />
Despite the negative economic climate in<br />
2001, the British import of table- &<br />
kitchenware continued to grow. In 2001, the<br />
total import grew by 7.5 percent in terms of<br />
value and 6.5 percent in terms of volume.<br />
That year, the import of table- &<br />
kitchenware amounted to € 1.4 billion and a<br />
volume of 405,000 tons.<br />
As in Germany, metalware is the most<br />
important product group imported by the<br />
United Kingdom, accounting for 27 percent<br />
of the total import. Looking at the import<br />
statistics, there is an interesting development<br />
to note. In 2000, the imported value of<br />
metalware increased by more than 19<br />
percent, the imported volume on the other<br />
hand dropped by 17 percent. This<br />
developing could indicate that the price per<br />
Figure 5.4<br />
400<br />
350<br />
300<br />
250<br />
200<br />
150<br />
100<br />
50<br />
-<br />
Imports of table- & kitchenware into<br />
United Kingdom by product group<br />
1999-2001, in € millions<br />
377<br />
Metalware<br />
300<br />
Plasticware<br />
280<br />
Glassware<br />
162<br />
Cutlery<br />
139<br />
Ceramicware<br />
101<br />
Porcelain & China<br />
1999<br />
2000<br />
2001<br />
Woodware<br />
53<br />
Source: Eurostat, 2002<br />
36
product is rising. The import of plasticware remained stable in terms of value. The volume<br />
however, increased by more than 8 percent, totalling 102,000 tons in 2001.<br />
Britain’s third import <strong>market</strong>, glassware, showed a drop of more 70 percent in 1999, this decrease<br />
was caused by the imports of huge volumes of glassware from Germany, which amounted to 147<br />
thousand tons in 1999. This figure is highly questionable, since according to the same Eurostat<br />
source, Germany only exported 2,3 thousand tons of glassware to The United Kingdom that year.<br />
Ceramicware and woodware were the two biggest growing import <strong>market</strong>s in 2001. In terms of<br />
value, the import grew respectively 14 and 12 percent. The United Kingdom is the EU’s most<br />
important importer of woodware. In 2001, the United Kingdom accounted for 28 percent of the<br />
EU imports of woodware.<br />
In 2001, intra-EU trade accounted for 38 percent of British imports. Italy (9%) and France (8%)<br />
are the most important suppliers. For Extra-EU trade, China is the main supplier in terms of<br />
value, as China supplies more than a quarter of the British import.<br />
Italy<br />
In 2001, Italy was the fourth EU importer of table- & kitchenware, with imports amounting to<br />
€ 695 million and 186,000 tons. After years of impressive growth, the Italian import of table- &<br />
kitchenware declined by 4 percent both in terms of value as in terms of volume.<br />
Figure 5.5 Imports of table- & kitchenware into<br />
Glassware, the biggest product group<br />
Italy by product group, 1999-2001, in<br />
imported by the Italians, accounted for<br />
€ millions<br />
almost a third of the total import of table- &<br />
kitchenware. In the mid-nineties, the import<br />
250 224<br />
of glassware showed strong growth. In<br />
1999<br />
2001, the import dropped by 2 percent both 200<br />
2000<br />
in terms of value and volume. Italy’s second<br />
145<br />
product group, porcelain and china, showed 150<br />
2001<br />
quite some fluctuations in the reviewed<br />
104 99<br />
period. In terms of volume, imports grew 100<br />
80<br />
between 1997 and 2001. In that period, the<br />
50<br />
30<br />
value of the import also rose, but in 2001<br />
13<br />
there was a turning point. That year the<br />
-<br />
import value amounted € 145 million,<br />
indicating a drop of 3 percent. Between<br />
1997 and 2000, the import of metalware<br />
showed a substantial growth which,<br />
however, ended in 2001. That year, the<br />
import dropped by 6 percent in terms of<br />
value and even 14 percent in volume. Source: Eurostat, 2002<br />
After years of considerable growth, the import of plasticware dropped by 4 percent in terms of<br />
value and 13 percent in terms of volume. In comparison with other EU-countries, the Italians<br />
import relatively little plasticware. Plasticware accounts for 24 percent of the total EU import of<br />
table- & kitchenware in terms of value, whereas in Italy plasticware accounts for only 14 percent<br />
of the import. The growth in metalware imports also ended in 2001. That year the imported<br />
volume dropped by a significant 14 percent. In terms of value, the import decreased by 6 percent.<br />
As in the rest of the EU, Italian cutlery prices dropped.<br />
Although Italy’s import of table- & kitchenware fell, the share deriving from outside the EU<br />
increased. This development indicates that EU-countries lost <strong>market</strong> share. Especially, the<br />
importance of Germany dropped considerably. In 2001, the Italians imported 14 percent of their<br />
total import from Germany. Ten years earlier, Germany accounted for more than 30 percent of<br />
Glassware<br />
Porcelain & China<br />
Metalware<br />
Plasticware<br />
Cutlery<br />
Ceramicware<br />
Woodware<br />
37
Italy’s import. It was mainly China and Eastern European countries which took advantage of the<br />
declining importance of intra-EU trade and showed considerable growth.<br />
Germany<br />
As stated earlier, Germany is the largest national import <strong>market</strong> of table- & kitchenware in the<br />
EU. In 2001, the German import showed the biggest decline of all the <strong>market</strong>s discussed in this<br />
<strong>survey</strong>. Imports dropped by 7.5 percent in terms of value and 7 percent in terms of volume,<br />
totalling € 1.8 billion in terms of value and 545,000 tons in terms of volume in 2001. In the four<br />
years preceding 2001, the German import grew on average 6 percent in terms of volume annually.<br />
The Eurostat statistics reveal that, except in the porcelain & china segment, all product groups<br />
imported by Germany declined in terms of value in 2001. Between 1997 and 2001, the porcelain<br />
& china import increased by almost 20 percent, amounting to € 169 million in 2001. The import<br />
of ceramicware dropped by more than 22 percent in that same period.<br />
Germany’s most important product group,<br />
metalware, dropped both in terms of value<br />
(7.5%) and in terms of volume (9%) after<br />
two year of considerable growth. In 2001,<br />
the import of metalware stood at € 478<br />
million. Germany’s second import <strong>market</strong> is<br />
plasticware, which accounts for 25 percent<br />
of the total import and accounted for a value<br />
of € 458 million. The import value of<br />
cutlery showed a tremendous decline of<br />
almost 12 percent in 2001. In the preceding<br />
year however, this product group<br />
represented a growth of almost 20 percent.<br />
The trade flows indicate that, as in the rest<br />
of the EU, the import deriving from outside<br />
the EU is becoming more important. In<br />
2001, more than 60 percent of the German<br />
table- & kitchenware import derived from<br />
extra-EU countries.<br />
Spain<br />
After years of considerable growth, the<br />
Spanish import of table- & kitchenware<br />
showed a tremendous drop. In 2001, the<br />
import decreased by 7 percent in terms of<br />
value and more than 10 percent in terms of<br />
volume. That year, the import of table- &<br />
kitchenware represented a value of € 554<br />
million and a volume of 182,000 tons.<br />
Glassware was the only import <strong>market</strong> in<br />
Spain which showed a slight growth in<br />
2001. Because of this development, it<br />
became the largest import <strong>market</strong> at the<br />
expense of metalware, reflecting the fact<br />
that metalware imports dropped by more<br />
than 15 percent in terms of value and by<br />
more than 20 percent in terms of volume.<br />
Spain’s third import <strong>market</strong>, plasticware,<br />
Figure 5.6<br />
600<br />
500<br />
400<br />
300<br />
200<br />
100<br />
-<br />
Figure 5.7<br />
180<br />
160<br />
140<br />
120<br />
100<br />
80<br />
60<br />
40<br />
20<br />
-<br />
478<br />
Metalware<br />
Glassware<br />
Imports of table- & kitchenware into<br />
Germany by product group, 1999-<br />
2001, in € millions<br />
458<br />
Plasticware<br />
366<br />
Glassware<br />
241<br />
Cutlery<br />
169<br />
Porcelain & China<br />
Ceramicware<br />
85<br />
1999<br />
2000<br />
2001<br />
Woodware<br />
32<br />
Source: Eurostat, 2002<br />
Imports of table- & kitchenware into<br />
Spain by product group, 1999-2001, in<br />
€ millions<br />
142<br />
136<br />
Metalware<br />
Plasticware<br />
90<br />
Porcelain & China<br />
80<br />
Cutlery<br />
62<br />
Ceramicware<br />
35<br />
1999<br />
2000<br />
2001<br />
Woodware<br />
8<br />
Source: Eurostat, 2002<br />
38
showed a tremendous development in the reviewed period. In the period 1992 to 2000, the import<br />
<strong>market</strong> more than tripled in terms of volume. In 2001 however, there was a turning point, as the<br />
imported volume dropped by 8 percent in terms of value and 15 percent in terms of volume.<br />
The import statistics concerning cutlery showed that the average prices of Spanish cutlery reflect<br />
a downwards trend. The import of ceramicware dropped for the second year in a row. In 2000, the<br />
import dropped by 7 percent and a year later the import dropped by almost 10 percent.<br />
In 2001, intra-EU trade accounted for 60 percent of Spanish imports. Italy (19%), France (14%)<br />
Germany (10%) and Portugal (7%) are Spain’s main suppliers within the EU. Regarding extra-<br />
EU trade, Eastern European countries like Poland became more important. China also plays a<br />
major role in Spain’s imports, in 2001 the import deriving from China accounted for 17 percent<br />
of Spanish imports.<br />
The Netherlands<br />
In 2001, imports into the Netherlands increased by almost 4 percent in value, amounting to € 624<br />
million. In terms of volume, the import amounted to 210,000 tons. Over a longer period of time,<br />
the Dutch import had shown a positive development. Between 1997 and 2001, the import grew 20<br />
percent. A notion should be made concerning the Dutch trade. Because the Netherlands is a<br />
trading nation, a lot of the EU imports go through the Rotterdam, one of the biggest harbors in the<br />
world. This makes the figures concerning the Dutch imports and exports less meaningful.<br />
After growing significantly in the late nineties, the Dutch import volume of metalware dropped<br />
for the second year in a row. The value however slightly recovered after dropping 3 percent in<br />
2000. The second import <strong>market</strong> regarding table- & kitchenware, plasticware, showed a<br />
considerable revival in 2001. That year, the imported value grew by 5 percent, and the volume<br />
even increased by more than 12 percent, rising to 88,500 tons.<br />
The Dutch import of cutlery showed an<br />
interesting tendency. In the period between<br />
1992 and 2001, the import in terms of value<br />
grew by 5.5 percent annually. The volume<br />
however, grew by more than 11 percent<br />
annually. This development indicates that<br />
cheaper products are becoming more<br />
popular.<br />
Figure 5.8<br />
Imports of table- & kitchenware into the<br />
Netherlands by product group, 1999-<br />
2001, in € millions value<br />
Of the six countries discussed in this <strong>survey</strong>, 80<br />
60<br />
the Dutch imported the most from suppliers 60<br />
44<br />
outside the EU. In the reviewed period, the 40<br />
13<br />
import share of EU countries dropped from 20<br />
70 percent in 1992 to 45 percent in 2001.<br />
-<br />
The importance of Italy, in particular,<br />
dropped considerably. Regarding extra-EU<br />
trade there are two significant developments<br />
to note firstly, the rise of Eastern European<br />
countries like Poland and, secondly, China<br />
becoming the most important supplier of<br />
Dutch imports of table- & kitchenware. Source: Eurostat, 2002<br />
180<br />
160<br />
140<br />
120<br />
100<br />
167<br />
Metalware<br />
139<br />
Plasticware<br />
125<br />
Glassware<br />
Cutlery<br />
76<br />
Ceramicware<br />
Porcelain & China<br />
1999<br />
2000<br />
2001<br />
Woodware<br />
39
5.2 Import by product group<br />
In this paragraph we will discuss the import per<br />
product group. In the figure attached to each<br />
product group, the quantitative developments<br />
are put down. The size of the circle indicates the<br />
size of the import <strong>market</strong> in terms of value. On<br />
the vertical axe you will find the import<br />
development in value in the year 2001. The<br />
horizontal axe gives to an indication of import<br />
development between 1997 and 2001 in terms of<br />
volume. We have used volume figures instead of<br />
value figures to indicate the long term<br />
development. The main reason for using the<br />
volume figures instead of the value figures is<br />
that the value figures deriving from Eurostat are<br />
How to read the graphics in paragraph 5.2:<br />
Example: Figure 5.9 indicates that the German<br />
import of metalware is the biggest metal import<br />
<strong>market</strong> in de EU in 2001 (size of the circle). In<br />
2001, the German import decreased by almost<br />
8 percent in terms of value (vertical axe). In the<br />
period 1997 till 2001, the German import<br />
<strong>market</strong> increased by only 3 percent in terms of<br />
volume (horizontal axe).<br />
Conclusion: Apart from strong fluctuations in<br />
import figures, the German import as a whole<br />
seems to be quite stable reflected by the long<br />
term growth of only 3 percent (volume).<br />
not corrected for inflation. Because the inflation differs from country to country, using the value<br />
figures to indicate import developments especially long terms ones, could lead to wrong<br />
assumptions. Additional information can be found in Appendix 2.<br />
Metalware<br />
In 2001, metalware was the leading product group imported by the EU-countries, representing a<br />
value of € 2.0 billion and a volume of 419,000 tons. In 2001, the imported value showed a small<br />
decline of 1 percent, whereas the volume dropped by 3 percent. Over the period between 1997<br />
and 2001, the import of metalware grew by 23 percent in value and 19 percent in volume. In<br />
Figure 5.9, we can see that Germany, the biggest import <strong>market</strong>, accounting for almost a quarter<br />
of the EU imports, declined in terms of value (vertical axis) in 2001. Over the period 1997 to<br />
2001, the German import of metalware in terms of volume only grew by 3 percent (horizontal<br />
axis). In 2001, the import volume even dropped by 9 percent. The United Kingdom is becoming<br />
more important, accounting for 19 percent of the EU imports. In 2001, the United Kingdom<br />
showed the most growth, as the import of metalwares increased by 11% in terms of value and 7<br />
percent on a volume basis. Other important import <strong>market</strong>s are France (13%), the Netherlands<br />
(8%), Belgium (8%), Spain (8%), Italy (5%) and Austria (4%).<br />
Figure 5.9<br />
Relative attractiveness of EU-countries with respect to the import development of<br />
metalware<br />
20%<br />
% growth 2001 in €<br />
15%<br />
United Kingdom<br />
10%<br />
Belgium/ Luxembourg<br />
Finland<br />
5%<br />
Netherlands<br />
Sweden<br />
Denmark<br />
Ireland<br />
0%<br />
Austria<br />
France<br />
-15% -5% 5% 15% 25% 35% 45% 55%<br />
-5% Portugal<br />
Italy<br />
Greece<br />
Germany<br />
-10%<br />
-15%<br />
-20%<br />
Spain<br />
% growth 1997 - 2001 in volume<br />
Source: Eurostat, 2002<br />
40
The importance of relatively small countries like the Netherlands and Belgium can be explained<br />
by the different cooking habits (see paragraph 3.2). In terms of volume the French import was<br />
sluggish, only growing 1 percent in 2001. The Dutch import decreased by 4 percent that year. The<br />
two Southern European countries highlighted in this <strong>survey</strong>, Italy and Spain showed a gigantic<br />
drop in 2001. The first dropped by 14 percent, the latter even by more than 20 percent. The years<br />
preceding 2001, these import <strong>market</strong>s represented healthy growth figures; therefore both <strong>market</strong>s<br />
still show a positive development in Figure 5.9.<br />
Origin of imports<br />
The import deriving from EU-countries is steadily dropping, mainly in favour of China. In 1997<br />
the EU countries accounted for 53 percent of the EU import, in 2001 this percentage dropped to<br />
50 percent. Of particular note, the importance of the EU’s main supplier, Italy, dropped from 19<br />
percent in 1997 to 17% percent in 2001. Other important EU suppliers are Germany (8%), France<br />
(7%) and Belgium (6%). Notably, China increased its share. China’s exports of metalwares to the<br />
EU grew by 34 percent from 97,000 tons to 130,000 tons between 1997 and 2001, giving China<br />
an import share of 31 percent on a volume basis, and 28 percent on a value basis. Other important<br />
Asian suppliers are Taiwan (4% of EU import value), India (3%) and Turkey (2%).<br />
Plasticware<br />
Despite the negative economic climate, the import of plasticware has shown an increase. In 2001,<br />
the import increased by 2 percent, totalling € 1.96 billion. In terms of volume the import of<br />
plasticware remained relatively stable, amounting to 523,500 tons. Looking at the plasticware<br />
<strong>market</strong> on a national level, we see that even in 2001, most countries showed an increase. Of the<br />
EU countries only Germany, Italy and Spain showed a decline. In 2001, the German <strong>market</strong><br />
dropped by 8 percent in value, on a volume basis, German imports decreased by more than 11<br />
percent. The Italian and Spanish import <strong>market</strong>s both have good positions in Figure 5.10,<br />
however this is mainly due to a considerable growth in the late nineties. In 2001, the Italian and<br />
Spanish <strong>market</strong> dropped by 13 and 15 percent in terms of volume. The import of the United<br />
Kingdom together with the import of the Netherlands grew by 8 and 5 percent respectively on a<br />
volume base. The French <strong>market</strong> remained rather stable in terms of volume in 2001.<br />
Figure 5.10 Relative attractiveness of EU-countries with respect to the import development of<br />
plasticware<br />
% growth 2001 in €<br />
40%<br />
35%<br />
30%<br />
Greece<br />
25%<br />
Denmark<br />
20%<br />
15%<br />
Netherlands<br />
Finland<br />
Belgium/ Luxembourg<br />
10%<br />
Ireland<br />
Sweden<br />
United Kingdom<br />
Portugal<br />
5%<br />
France<br />
Austria<br />
0%<br />
-15% -5% 5% 25% 45% Italy 65% 85%<br />
-10%<br />
Germany<br />
Spain<br />
-15%<br />
-20%<br />
% growth 1997 - 2001 in volume<br />
Source: Eurostat, 2002<br />
41
Origin of imports<br />
Although EU manufacturers still dominate the <strong>market</strong>, their position is steadily declining. In<br />
1997, the EU manufacturers accounted for 70 percent of the EU import and, five-years later, this<br />
share had dropped to 65 percent. Despite the fierce competition, mainly from China, which is the<br />
largest EU supplier of plasticware (15% of the total EU import in value), the EU manufacturers<br />
still play a dominant role in the EU <strong>market</strong>. The dominance of the EU manufacturers is mainly<br />
due to the “economies of scale”, which enable the manufacturers to produce at low cost. (See also<br />
chapter 4). In 2001, 65 percent of the total import derived from EU-countries. The most import<br />
suppliers in the EU are Spain (14% of the total EU import in value), Italy (10%), Germany (10%),<br />
France (9%) and the Netherlands (7%). Other important non-EU suppliers are the United States<br />
(4%), Taiwan (3%) and Poland (3%).<br />
Glassware<br />
In 2001, the EU import of glassware dropped by 2 percent in value terms, to a value of € 1.85<br />
billion. The imported volume amounted to 780,000 tons, representing a drop of 9 percent in<br />
comparison with 2000. Over the period between 1997 and 2001, the glassware <strong>market</strong> shows a<br />
growth trend, as volume increased by 18 percent.<br />
Looking at a national level, we see that only a few countries show growth in 2001. Germany and<br />
France together with the United Kingdom are the leading import <strong>market</strong>s, with shares of<br />
respectively 20, 12 and 15 percent. The UK, together with Ireland, ranks amongst the highest<br />
growth <strong>market</strong>s in the EU that year. The United Kingdom, however, shows an interesting<br />
development, as the imported value increased by 7 percent, whereas the volume dropped by<br />
almost 14 percent. The Belgium/ Luxembourg import also shows in interesting development, in<br />
2000, as the import increased by 34 percent, whereas in 2001, the import dropped by 28 percent.<br />
Over a longer period of time, the Netherlands shows the highest growth, but this growth occurred<br />
mainly in the late nineties. In 2000, the Dutch import even dropped by 13 percent on a volume<br />
basis, whereas, the value grew by 10 percent. In 2001, however the imported volume increased by<br />
a mere 3 percent. France and Spain also showed a growth in terms of volume, both import<br />
<strong>market</strong>s grew by 5 percent. The import of Germany and Italy declined by 5 and 3 percent that<br />
same year.<br />
Figure 5.11 Relative attractiveness of EU-countries with respect to the import development of<br />
glassware<br />
15%<br />
% growth 2001 in €<br />
Ireland<br />
10%<br />
United Kingdom<br />
Greece<br />
5%<br />
Finland<br />
Denmark<br />
France<br />
Austria<br />
Spain 0%<br />
Sweden<br />
Netherlands<br />
-15% -5% 5% 15% 25% 35% 45% 55%<br />
-5%<br />
Italy<br />
-10%<br />
Portugal Germany<br />
-15%<br />
Belgium/ Luxembourg<br />
-20%<br />
-25%<br />
% growth 1997 - 2001 in volume<br />
Source: Eurostat, 2002<br />
42
Origin of imports<br />
In total, the EU-countries accounted for 56 percent of the EU import on value basis. France is by<br />
far the most important glassware supplier in the EU. In 2001, the French accounted for 17 percent<br />
of the total EU glassware import. Other important EU suppliers are Germany (9%), Italy (8%)<br />
and the Netherlands (5%). The EU countries are slowly losing ground, especially to Eastern<br />
European countries like Poland (6%), Czech Republic (6%), Romania (2%) and Slovakia (2%).<br />
Also, Asian countries like China (8%) and Turkey (6%) are becoming increasingly important.<br />
The decline of the EU countries has two main explanations, firstly, the low-priced products made<br />
by manufacturers in non EU-countries And, secondly, EU manufacturers, like their American<br />
counterparts, shifting production to cheap regions in Eastern Europe and Asia.<br />
Porcelain & China<br />
In 2001, EU imports remained stable in terms of value, at € 839 million. The import volume<br />
amounted to 271,000 tons, indicating a small decline of 1 percen t in comparison with the<br />
previous year. Between 1997 and 2001, the total EU import on a volume basis increased by 33<br />
percent. This percentage however, gives a distorted picture because of the enormous growth of<br />
the British import <strong>market</strong>, which grew by 123 percent between 1997 and 2001. In 2001, the two<br />
biggest import <strong>market</strong>s, Germany (20% of total EU imports), and France (13%) showed<br />
increases, the latter only marginal. The German import value grew by 6 percent in 2001, the<br />
imported volume showed a small decline of 1 percent. France’s import in terms of volume<br />
dropped by 2 percent, that same year. The United Kingdom together with Ireland showed a<br />
tremendous growth. In the period between 1997 and 2001, Spain also developed to one of the<br />
EU’s leading porcelain & china <strong>market</strong>s. In 2001, however the <strong>market</strong> dropped by 3 percent in<br />
terms of value and 26 percent in terms of volume, making it the biggest decliner in volume terms<br />
of 2001.<br />
The United Kingdom together with the Netherlands showed a stunning growth in terms of volume<br />
in 2001, the Dutch import grew by 12 percent, the United Kingdom’s import even increased by<br />
more than 18 percent. The Italian import remained rather stable only growing by 2 percent.<br />
Figure 5.12 Relative attractiveness of EU-countries with respect to the import development of<br />
porcelain & china<br />
30%<br />
25%<br />
Ireland<br />
% growth 2002 in €<br />
20%<br />
15%<br />
Germany<br />
10%<br />
United Kingdom<br />
5%<br />
Netherlands Greece<br />
Denmark<br />
France<br />
0%<br />
Portugal<br />
-30% 20% Italy 70% 120%<br />
-5%<br />
Austria<br />
-10%<br />
Finland-15%<br />
Belgium/ Luxembourg<br />
-20%<br />
Sweden<br />
% growth 1997 - 2001 in volume<br />
Spain<br />
Source: Eurostat, 2002<br />
43
Origin of imports<br />
In 2001, 70 percent on volume basis and 56 percent in terms of value derived from non-EU<br />
destinations, indicating a polarization between inexpensive products, deriving mainly from China,<br />
and premium-end products deriving from EU-countries. In general, the importance of the EU<br />
countries is declining. In 1997, the EU-countries supplied 56 percent (on value basis) of the EU<br />
total import, whereas in 2001, this percentage had dropped to 44 percent. Within the EU,<br />
Germany, with a share of 16 percent is by far the biggest supplier, followed by the United<br />
Kingdom (5%), France (5%) and Belgium (3%). On a volume basis, the picture is totally<br />
different; Germany only supplies 8 percent of the EU import, followed by Italy (5%) and the<br />
Netherlands (5%), whereas China supplies 20 percent.<br />
Also, Eastern European countries play a major role in the EU porcelain & china <strong>market</strong>, mainly<br />
Poland (10%) the Czech Republic (10%) and Romania (3%). Other important suppliers are China<br />
(10% on value basis), Turkey (3%), Indonesia (3%), Thailand (2%) and Bangladesh (2%).<br />
Ceramicware<br />
The EU import of ceramicware has remained rather stable, both in value and in volume terms.<br />
Between 1997 and 2001, the imported volume only increased by 2 percent, amounting to 273,500<br />
tons. In 2001, imports represented a value of € 585 million. Overall, it appears that ceramicware<br />
is more popular in the Northern regions of the EU, reflected by the import size of countries like<br />
the Netherlands, Belgium, France, Germany and the United Kingdom. The latter is the biggest<br />
import <strong>market</strong> in the EU, accounting for 24 percent of the total EU imports. In 2001, imports of<br />
ceramicware by the United Kingdom grew by 14 percent, amounting to € 139 million. France, the<br />
second import <strong>market</strong> in the EU, showed a small decline of 3 percent that year. However, in the<br />
reviewed period between 1997 and 2001, French imports grew by 28 percent, representing the<br />
largest growth of all the EU-countries. Germany accounted for 15 percent of the EU imports.<br />
Between 1997 and 2001, German imports fell by 12 percent.<br />
In 2001, the imported volume of the United Kingdom grew by a stunning 36 percent, whereas the<br />
Spanish, German and Italian dropped by respectively 10, 8 and 6 percent. The French import<br />
remained rather stable.<br />
Figure 5.13 Relative attractiveness of EU-countries with respect to the import development of<br />
ceramicware<br />
25%<br />
20%<br />
% growth 2001 in €<br />
15%<br />
United Kingdom<br />
Netherlands<br />
10%<br />
Ireland<br />
Greece<br />
5%<br />
-35%<br />
0%<br />
Portugal<br />
-25% -15% -5% 5% 15%<br />
Finland Spain<br />
-5%<br />
Sweden<br />
France<br />
25% 35%<br />
Denmark<br />
Germany<br />
-10%<br />
Austria<br />
Belgium/ Luxembourg<br />
-15%<br />
Italy<br />
-20%<br />
% growth 1997 - 2001 in volume<br />
Source: Eurostat, 2002<br />
44
Origin of imports<br />
Like the china & porcelain import <strong>market</strong>, Asian countries dominate the ceramicware <strong>market</strong>. In<br />
2001, the non EU-countries accounted for 59 percent of the EU import on value basis and more<br />
than 71 percent on volume basis. The major difference, however, is that China alone (13% import<br />
share on a value basis) does not dominate the imports in terms of volume. Other Asian countries,<br />
like Thailand (12%), Malaysia (3%) and Taiwan (3%) also play an important role in supplying<br />
the EU ceramicware <strong>market</strong>. The position of Eastern European countries is also less strong than<br />
in the china & porcelain <strong>market</strong>. Romania (4% <strong>market</strong> share on a value basis) is the largest<br />
Eastern Europe supplier, followed by Poland (2%).<br />
Of the EU-countries, Spain (15%) together with the United Kingdom (12%) and Italy (11%) are<br />
the leading suppliers on a value basis. If we compare these figures with the volume shares, we see<br />
that the United Kingdom supplies high-end products. The United Kingdom’s import share in<br />
terms of volume is only 5 percent whereas its import share in terms of value is almost 12 percent.<br />
Cutlery<br />
The cutlery import is very sensitive to the economic climate, reflected by the negative growth in<br />
most EU-countries in 2001. However, in the period between 1997 and 2000, the EU import on a<br />
volume basis represented an impressive growth of 47 percent. In 2001, there was a turning point,<br />
as the imported volume decreased by 3 percent, the value even dropping by 7 percent, to 115,000<br />
tons and € 940 million respectively. As can be seen in Figure 5.12, Germany, United Kingdom<br />
and France are the main import <strong>market</strong>s in the EU, accounting for respectively 26, 17 and 11<br />
percent. In 2001, the United Kingdom together with Austria and Denmark were one of the few<br />
import <strong>market</strong>s to show any growth. The UK grew by 7 percent in terms of value and even 9<br />
percent in terms of volume. Over the reviewed period, Italy showed the most growth between<br />
1997 and 2001. In 2001 however, Italian imports dropped by 3 percent in value and 12 percent in<br />
volume.<br />
In volume terms the Germany, France and Spanish import dropped by 8, 10 and 11 percent<br />
respectively. The Dutch import showed an increase in volume of 7 percent, whereas the value of<br />
this import dropped by 2 percent.<br />
Figure 5.14 Relative attractiveness of EU-countries with respect to the import development of<br />
cutlery<br />
15%<br />
% growth 2001 in €<br />
10%<br />
United Kingdom<br />
5% Austria<br />
Belgium/ Luxembourg<br />
Denmark<br />
0%<br />
-15%<br />
-5%<br />
35%<br />
Greece<br />
Netherlands<br />
85% 135% Italy 185%<br />
Sweden<br />
-10%<br />
Ireland<br />
France<br />
Spain<br />
-15% Germany<br />
Finland<br />
-20%<br />
Portugal<br />
-25%<br />
-30%<br />
% growth 1997 - 2001 in volume<br />
Source: Eurostat, 2002<br />
45
Origin of imports<br />
The EU cutlery <strong>market</strong> is polarizing between high-end products deriving from EU-countries and<br />
cheap imports deriving from China. In 2001, China accounted for 55 percent of EU imports in<br />
terms of volume but just 37 percent on a value basis. In the reviewed period between 1997 and<br />
2001, the importance of the EU countries as suppliers of cutlery dropped. In that period, the<br />
import of cutlery deriving from EU countries increased by 21 percent whereas the import deriving<br />
from non-EU-countries increased from 55,100 tons to 86,800 tons, a growth of 58 percent.<br />
In 2001, the EU-countries only accounted for 32 percent of the EU import of cutlery. Germany is<br />
by far the most important supplier, with a 10 percent share of the total EU import on value basis<br />
and only 6 percent on volume basis, followed by Italy (5% of the EU import in terms of value),<br />
France (4%) and the Netherlands (4%). As it seems, not only the EU-countries felt the<br />
competition from China, as other Asian countries <strong>market</strong>s, South Korea (7%), Thailand (3%),<br />
Japan (2%) and Taiwan (2%) were also influenced by Chinese imports.<br />
Woodware<br />
The woodware import <strong>market</strong> is by far the smallest of all the table- & kitchenware segments in<br />
this <strong>survey</strong>, representing 2 percent of total EU table- & kitchenware imports. In 2001, the EU<br />
import of woodware grew by 3 percent to a value of € 183 million. On a volume basis, the import<br />
only showed a small growth of 1 percent, to 60,200 tons. The United Kingdom accounted for 28<br />
percent of the EU imports of woodware, making it almost twice as big as the second import<br />
<strong>market</strong>, Germany. Imports to the United Kingdom also showed a positive growth of 12 percent, to<br />
a value of € 52.6 million. The German import dropped by 8 percent, but in the years preceding<br />
2001, the import grew on average more than 4 percent annually. In the period between 1997 and<br />
2001, Italy also showed a healthy growth, as the imported volume grew 53 percent.<br />
Of the six countries highlighted, only the British import grew in terms of volume (19%). The<br />
import of other countries dropped between the 3 percent for Spain and even 27 percent for the<br />
Netherlands.<br />
Figure 5.15 Relative attractiveness of EU-countries with respect to the import development of<br />
woodware<br />
45%<br />
Ireland<br />
% growth 2001 in €<br />
35%<br />
Greece<br />
Austria<br />
25%<br />
15% United Kingdom<br />
5%<br />
Belgium/ Luxembourg<br />
France<br />
Italy<br />
Spain<br />
-15% -5% 5% 25%<br />
Denmark<br />
Netherlands Sweden 45% 65% 85% 105%<br />
-15%<br />
Germany<br />
Portugal<br />
Finland<br />
-25%<br />
% growth 1997 - 2001 in volume<br />
Source: Eurostat, 2002<br />
46
Origin of imports<br />
Thailand and China dominated the EU import <strong>market</strong> of woodware, together accounting for more<br />
than half of the EU imports in terms of volume. On a value basis, China and Thailand both<br />
account for 23 percent of the EU import. Other important Asian suppliers are Taiwan (3%) and<br />
Vietnam (3%). Eastern European countries also supply an important share of the EU imports;<br />
leading Eastern European countries are Poland (5%), Slovenia (3%), the Czech Republic (1%)<br />
and Romania (1%). The EU countries only account for 26 percent of the EU imports, of which<br />
the leading EU suppliers are Germany (4%), Belgium (4%), Italy (3%) and the Netherlands (3%).<br />
47
5.3 The role of Developing Countries<br />
This paragraph discusses the role of developing countries in the table- & kitchenware <strong>market</strong> in<br />
the EU. By developing countries, we mean the countries on the OECD DAC list, which can be<br />
found in Appendix 5.<br />
The role of developing countries in EU imports of table- & kitchenware increased considerably,<br />
as can be seen in Figure 5.16. In 2001, the imports deriving from developing countries rose by 5<br />
percent, reaching € 2.3 billion. In the reviewed period between 1997 and 2001, the import share<br />
of developing countries in total EU imports rose from 25 percent in 1997 to 31 percent in 2001,<br />
whereas the import share of most EU-countries declined, as also can be seen in Figure 5.16.<br />
Figure 5.16 Trends in EU-import by leading suppliers (in 1,000 tons)<br />
500<br />
450<br />
400<br />
350<br />
)<br />
tons (in 1,000<br />
300<br />
250<br />
200<br />
150<br />
100<br />
50<br />
0<br />
1997 1998 1999 2000 2001<br />
China Italy France Germany Developing Countries (excl. China)<br />
Source: Eurostat, 2002<br />
During the reviewed period, the import deriving from developing countries increased by 58<br />
percent in terms of volume. Some emerging economies in Asia, with natural resources and low<br />
labour costs, have set up their own table- & kitchenware industry, strongly dedicated to lowpriced<br />
exports. At the same time, many EU manufacturers have shifted their production to these<br />
countries to benefit from these same advantages. They combine their efficient and high-quality<br />
production systems with the low labour costs in these countries. This development, in turn, has<br />
offered the local manufacturers in developing countries a chance to copy the new technologies<br />
and production systems. Therefore, the quality of their products has improved considerably.<br />
Especially China and, to a lesser extent, Thailand have taken advantage of these developments<br />
and therefore pose an increasing threat to EU manufacturers.<br />
48
The other developing countries (excluding China and Thailand) are currently also expanding their<br />
exports, although it will take a long time for them to obtain a significant position in the<br />
international table- & kitchenware trade, because:<br />
• Most developing countries do not have a well-established table- & kitchenware industry.<br />
Production capacity, the level of technology, product innovations and variety in design<br />
are limited.<br />
• EU manufacturers continue to sub-contract to foreign manufacturers in Eastern European<br />
countries and China, which are more flexible in terms of meeting their specific<br />
requirements and, in the case of the Eastern European countries, are closer to the sales<br />
<strong>market</strong>.<br />
Eastern European countries such as Poland, Czech Republic, Romania and Hungary, though not<br />
considered to be developing countries, have also benefited from the outsourcing by EU<br />
manufacturers. Therefore, these countries are therefore considered to be the most important<br />
competitors of the developing countries. The manufacturers in Eastern European countries<br />
distinguish themselves by offering a higher quality, since they are not able to compete with the<br />
low Asian prices.<br />
These manufacturers in Eastern European countries will also benefit from joining the EU, mainly<br />
because no import duties are levied between EU-countries.<br />
Table 5.1<br />
Main developing country suppliers (share in % of imported value supplied by<br />
developing countries, 2001)<br />
Metalware China (77%), India (8%), Turkey (6%), Thailand (3%), Vietnam (1%),<br />
Indonesia (1%), Serbia & Montenegro (1%)<br />
Plasticware China (82%), Thailand (8%), Turkey (2%) Malaysia (2%), India (2%),<br />
Indonesia (1%), Slovenia (1%)<br />
Glassware China (42%), Turkey (35%), Slovenia (8%), Thailand (3%), India (3%),<br />
Indonesia (2%), Brazil (2%), Mexico (1%)<br />
Cutlery<br />
China (80%), Indonesia (8%), Vietnam (3%), Thailand (3%), India (2%), Brazil<br />
China & Porcelain<br />
(2%), Pakistan (1%)<br />
China (37%), Turkey (12%), Indonesia (11%), Thailand (9%) Bangladesh<br />
(8%), Sri Lanka (4%), India (3%), Tunisia (3%),<br />
Ceramicware Thailand (42%), China (30%), Malaysia (7%), Indonesia (4%), Turkey (4%),<br />
Vietnam (3%), Brazil (2%), Slovenia (1%)<br />
Woodware China (40%), Thailand (40%), Slovenia (5%), Vietnam (5%), Indonesia (3%),<br />
India (2%), Malaysia (1%), South Africa (1%)<br />
The importance of the developing countries in glassware is rising, as can be seen in Figure 5.16.<br />
It should however be noted that China and Thailand account for the lion’s share of this import.<br />
Woodware and cutlery are the main product groups imported from developing countries. Of these<br />
products, the bulk is imported from China, Thailand and Indonesia. Woodware is a known<br />
product deriving from developing countries, mainly because such products do not require difficult<br />
and money-consuming production processes.<br />
49
Figure 5.17 Share of developing countries in the total import of table- & kitchenware in the EU, by<br />
product, 1997-2001, % of imported value<br />
EU-total<br />
28%<br />
Glassware<br />
Plasticware<br />
Porcelain & China<br />
19%<br />
18%<br />
26%<br />
1997<br />
1999<br />
2001<br />
Ceramicware<br />
30%<br />
Metalware<br />
36%<br />
Cutlery<br />
45%<br />
Woodware<br />
57%<br />
0% 10% 20% 30% 40% 50% 60%<br />
Source: Eurostat, 2002<br />
Of the countries discussed in this <strong>survey</strong>, the United Kingdom imports the most from developing<br />
countries. In 2001, the import deriving from developing countries amounted to € 586.3 million.<br />
This indicates that, of the total import, 42 percent derives from developing countries. However,<br />
when we exclude the share of China, this percentage drops to 16 percent, indicating that China<br />
has a dominant position in the UK imports. Germany is the second importer in size. In 2001, the<br />
Germans imported € 565 million from developing countries (€ 169 million excluding China).<br />
France imports relatively the least from developing countries, since only 27 percent of their total<br />
import derives from these countries. If we exclude China, the import from developing countries<br />
only amounts to 9 percent. The Netherlands is the fourth largest importer. Of their total import,<br />
the Dutch import approximately 36 percent from developing countries, representing a size of<br />
€ 223 million. Spain was the smallest importer in 2001, as only a quarter of their import derived<br />
from developing countries.<br />
50
6 EXPORT<br />
Total exports by the EU<br />
The EU is the leading exporter of table- & kitchenwares in the world, with France, Italy and<br />
Germany being among the world’s top ten exporting countries. Looking at the destinations of the<br />
EU export, we can see that the intra-EU trade is declining. In 1992, the EU accounted for 65<br />
percent of the export. In 2001, this percentage had dropped to 55 percent. The drop of the intra-<br />
EU trade was mainly caused by the competition from cheap-labour countries in Asia and Eastern<br />
Europe, discussed earlier.<br />
Major destinations for EU export within the EU were Germany (11%), France (9%), United<br />
Kingdom (6%), the Netherlands (5%), Spain (5%), Italy (4%) and Belgium (4%). Important non-<br />
EU destination were; USA (14%), Japan (4%), Switzerland (4%), U.A. Emirates (2%) and<br />
Norway (2%)<br />
In 2001, the EU exports of table- & kitchenware showed a slight decline after growing by more<br />
than 9 percent in 2000. The total value of exports by EU countries amounted to € 8.6 billion in<br />
2001. In terms of volume, exports amounted to 2 million tons. In the five year period, between<br />
1997 and 2001, the EU export increased by almost 7 percent in value and only 2 percent in<br />
volume. France is the EU’s largest exporter, accounting for 22 percent of the EU exports in 2001:<br />
€ 1.85 billion and 506,000 tons. France is followed by Italy (20% of EU exports in value),<br />
Germany (17%), Belgium (9%) and the United Kingdom (8%). Due to negative economic<br />
developments, exports of most EU-countries experienced a decline or remained stable in 2001.<br />
However between 1997 and 2001, the Netherlands, Ireland and Denmark increased their export.<br />
Figure 6.1<br />
Total exports of table- & kitchenware into the EU, 1999-2001, in € millions<br />
2,000<br />
1,800<br />
1,600<br />
1,852<br />
1,741<br />
1,484<br />
1999<br />
2000<br />
1,400<br />
2001<br />
1,200<br />
1,000<br />
800<br />
751<br />
710<br />
600<br />
400<br />
200<br />
423<br />
377<br />
333 315<br />
190 179<br />
129<br />
48 44 29<br />
-<br />
France<br />
Italy<br />
Germany<br />
Belgium<br />
United Kingdom<br />
Netherlands<br />
Spain<br />
Austria<br />
Portugal<br />
Sweden<br />
Denmark<br />
Ireland<br />
Luxembourg<br />
Finland<br />
Greece<br />
Source: Eurostat, 2002<br />
51
Glassware (31% of total EU export) was the most important table- & kitchenware segment<br />
exported by the EU, followed by metalware (23%), plasticware (19%), porcelain & china (11%),<br />
ceramicware (8%), cutlery (8%) and woodware (1%). In the reviewed period, metalware became<br />
more important for the EU export, explained by the fact that because of the increasing<br />
competition, EU manufacturers turned to the more complex products like metalware. These<br />
products require high-scale technical production processes (see also Chapter 4).<br />
France<br />
France, the largest EU exporter, controlled a 22% share of all table- & kitchenware exported from<br />
the EU. In 2001, the export reached a value of € 1.85 billion and a volume of 506,000 tons. In the<br />
reviewed period, extra-EU exports became increasingly important as, between 1997 and 2001, the<br />
French extra-EU export grew by 40 percent in value, whereas the intra-EU export only grew by 8<br />
percent.<br />
As can be seen in Chapter 4, France is known for its glassware, which is also reflected in the<br />
export figures. Glassware accounts for more than 50 percent of the French export of table- &<br />
kitchenware. Other important export products were metalware (19%), plasticware (13%),<br />
porcelain & china (7%), cutlery (5%), and ceramicware (4%).<br />
In 2001, around 47% of France’s total exports went to other EU countries, with Germany (10%),<br />
Italy (7%), United Kingdom (7%) and Belgium being the leading destinations within the EU. The<br />
United States (15%), U.A. Emirates (5%), Japan (5%) and Switzerland (3%) were the major non-<br />
EU destinations.<br />
United Kingdom<br />
In 2001, the United Kingdom exported 105,000 tons of table- & kitchenware with a total value of<br />
€ 710 million, or 8% of total EU exports. Between 1997 and 2001, the UK export decreased by<br />
22% in terms of value, while the volume declined by 34%, which partly can be attributed to the<br />
strength of the Pound Sterling, which made exports relatively expensive for other countries.<br />
By far the most important product groups exported by the British are ceramicware and china &<br />
porcelain, which together accounted for 55 percent of the table- & kitchenware exports. Other<br />
export products were plasticware (18%), glassware (10%), metalware (9%), cutlery (8%) and<br />
woodware (1%).<br />
In 2001, around 48% of the British exports went to other EU-countries, with Ireland (17%), the<br />
Netherlands (7%), Germany (5%) and Italy (5%) being the leading destinations within the EU. Of<br />
the non-EU destinations, the United States is by far the most important, accounting for 21 percent<br />
of the British exports. Other important non-EU destinations are Japan (9%), Canada (4%) and<br />
Australia (3%).<br />
Italy<br />
Italy is the second largest EU exporter of table- & kitchenware controlling one fifth of all table-<br />
& kitchenware exported from the EU. In 2001, the export reached a value of € 1.74 billion and a<br />
volume of 492,000 tons. In the five-year period between 1997 and 2001, Italy’s export increased<br />
by almost 7 percent in value but only 2 percent in volume. In 2001, despite the negative economic<br />
climate, the export increased by 3 percent. This was mainly caused by the positive development<br />
in the export of metalware. In the same period, the volume dropped by 2%.<br />
The most important export product was metalware, which accounted for more than 40 percent of<br />
the total exports. Other export products were glassware (23%), plasticware (16%), ceramicware<br />
(10%), cutlery (5%), porcelain & china (5%) and woodware (1%). During the reviewed period<br />
metalware and plasticware became increasingly important, especially at the expense of glassware.<br />
In 2001, around 48% of the Italian exports went to other EU-countries, with Germany (12%),<br />
France (11%), United Kingdom (6%) and Spain (6%) being the leading destinations. Of the non-<br />
52
EU destinations, the United States is by far the most important, accounting for 16 percent of the<br />
Italian export. Other important non-EU destinations are Switzerland (4%), Japan (3%), Canada<br />
(2%), Russia, (2%), Croatia (2%), U.A. Emirates (1%) and Australia (1%),<br />
Germany<br />
In 2001, Germany exported 252,000 tons of table- & kitchenware with a total value of € 1.48<br />
billion, or 17% of total EU exports. Between 1997 and 2001, German exports increased by 12%<br />
in terms of value, the volume increased by 11%. However in 2001, the German export was down,<br />
by 3 percent in value.<br />
Glassware accounted for 28 percent of the table- & kitchenware exported by Germany, followed<br />
by porcelain & china (21%), which makes Germany the leading exporter of porcelain & china in<br />
the EU. Metalware, with a share of 20 percent is the third product group in size, followed by<br />
plasticware (15%), cutlery (14%), ceramicware (2%) and woodware (1%).<br />
In 2001, around 51% of the German exports went to other EU-countries, with Austria (9%),<br />
France (8%), the Netherlands (7%), Italy (6%) and the United Kingdom (5%) being the leading<br />
destinations within the EU. Of the non-EU destinations, the United States is by far the most<br />
important, accounting for 14 percent of the German exports. Other important non-EU destinations<br />
are Switzerland (8%), Czech Republic (4%), and Japan (4%).<br />
Spain<br />
In 2001, Spain exported 144,000 tons of table- & kitchenware with a total value of € 377 million,<br />
or 4% of total EU exports. In terms of value, Spain is only the eleventh exporter in size, whereas<br />
in volume Spain is fifth exporter, just after Belgium, making Spain in terms of volume a bigger<br />
exporter than the United Kingdom and the Netherlands. Between 1997 and 2001, Spain’s exports<br />
increased by 17% in terms of value, the volume even increased by 22 percent. After a stunning<br />
growth of more than 16 percent in 2000, Spanish exports dropped by 3 percent in 2001. The<br />
export volume however showed a totally different picture as, both in 2000 as in 2001, the export<br />
in terms of volume dropped.<br />
Glassware accounted for 31 percent of the table- & kitchenware exported by Spain, followed by<br />
metalware (27%), plasticware (24%), cutlery (9%), porcelain & china (5%), ceramicware (3%)<br />
and woodware (1%).<br />
In 2001, around 59 percent of the Spanish exports went to other EU countries, with France being<br />
the leading destination, with a share of 21 percent, followed by Portugal (12%), Germany (9%)<br />
Italy (6%). Of the non-EU destinations, the United States is by far the most important, accounting<br />
for 9 percent of the Spanish export. Other important non-EU destinations are Mexico (2%), Czech<br />
Republic (1%), Cuba (1%) and Canada (1%).<br />
The Netherlands<br />
The Netherlands exported a total volume of 107,000 tons of table- & kitchenware, valued at € 423<br />
million, in 2001. Between 1997 and 2001, Dutch exports increased by 14% in value, due to the<br />
increasing importance of the glassware export. In 2001, like in most other EU-countries, there<br />
was a turning point, both the exported volume as well as the value dropped by respectively 5 and<br />
3 percent.<br />
In 2001, glassware accounted for 27% of total Dutch table- & kitchenware exports, followed by<br />
plasticware (26%), metalware (22%), cutlery (10%), porcelain & china (10%), ceramicware (3%)<br />
and woodware (1%).<br />
53
The greater part of these exports (79%) went to other EU <strong>market</strong>s; this can partly be explained by<br />
the fact that the Netherlands is a major trading nation. A lot of EU imports go through the port of<br />
Rotterdam, one of the biggest harbours in the world. This makes the figures concerning the Dutch<br />
imports and exports highly questionable.<br />
Germany accounts for more than a quarter of the Dutch exports, followed by Belgium (17%), the<br />
United Kingdom (9%) and France (9%). Of the non-EU destinations Japan with 4 percent leads,<br />
followed by the United States (3%), Switzerland (1%) and Poland (1%).<br />
54
Overview<br />
In the figure below we have presented a graphic summary of Chapters 3 to 6. The size of each<br />
circle represents the size of the <strong>market</strong> in terms of consumption. As can be seen in this figure,<br />
France together with the United Kingdom are the leading <strong>market</strong>s in terms of consumption size.<br />
On the horizontal axis, lies the trade balance, which is the difference of the export minus the<br />
import. Of the six countries discussed in this <strong>survey</strong>, only Italy and France have a positive trade<br />
balance (for accurate numbers, refer the table in the report summary). The vertical axis represents<br />
the percentage of the import deriving from developing countries. In the figure below, the<br />
horizontal axis crosses the vertical axis at 28 percent, indicating that the EU-countries on average<br />
import 28 percent of their total import from developing countries. As can be seen, the United<br />
Kingdom, together with The Netherlands and Germany, import more than the EU average from<br />
developing countries. In 2001, the United Kingdom imported 42 percent of its import from<br />
developing countries. When looking at the variables in this figure, the upper-left corner represents<br />
the most attractive table- & kitchenware <strong>market</strong>s for developing countries in terms of import<br />
share and trade balance. In the figure below, we have also mentioned the <strong>market</strong> growth of the<br />
countries reviewed. The United Kingdom together with Italy, are the star performers, growing<br />
respectively 30 and 28 between 1998 and 2002.<br />
Graphic summary Chapters 3-6: Market attractiveness on basis of <strong>market</strong> size, import share<br />
deriving from developing countries, trade balance and <strong>market</strong> growth 1998-2002<br />
United Kingdom<br />
growth 30%<br />
Germany<br />
growth 2%<br />
Trade balance in € million<br />
Netherlands<br />
growth 14%<br />
50%<br />
45%<br />
40%<br />
35%<br />
30%<br />
Italy<br />
growth 28%<br />
-1000 -800 -600 -400 -20025%<br />
0 200 400 600 800 1000 1200 1400<br />
Spain<br />
growth 16% 20%<br />
15%<br />
France<br />
growth 8%<br />
10%<br />
5%<br />
0%<br />
% of import from DC<br />
Source: Eurostat & Euromonitor, 2002/ <strong>2003</strong><br />
The attractiveness of an export <strong>market</strong> is not solely determined by the factors discussed in the<br />
overview. Factors like trade structures, consumer preferences and tastes are also very important<br />
for successful export <strong>market</strong>ing. An exporter should also note the different requirements laid<br />
down in legislation and restrictions of the export <strong>market</strong>. In Chapter 9 of this <strong>survey</strong>, the<br />
requirements of access are discussed.<br />
55
7 TRADE STRUCTURE<br />
Trade or distribution channels maybe described as the “paths goods – and title to these goods –<br />
follow from manufacturer to consumer”, according to the centre for Excellence in Financial<br />
Management. This chapter will analyse the distribution chain for the table- & kitchenware<br />
<strong>market</strong>. We will deal with the major sales intermediaries, like agents, wholesalers, etc, and their<br />
role in the distribution chain. Furthermore, the main retailers of table- & kitchenware in the EU<br />
are also discussed.<br />
7.1 EU trade channels<br />
The trade and the distribution systems in the European Union are in a permanent state of<br />
development. According to a <strong>survey</strong> of the International Trade Centre, one of the noticeable<br />
developments concerning the EU-trade channels is the shortening of the distribution chain. This is<br />
the result of vertical integration and scaling up. Intermediaries are being cut out. The main<br />
motivations are to exercise better control and cut costs. Manufacturers, like for example<br />
Waterford-Wedgwood, are selling their products through manufacturer-owned brand stores and<br />
through the internet.<br />
Another related development, which also contributes to a shortening of the chain, is the rise of<br />
private labelling. IKEA, for example, has its own range of cheap, good quality table- &<br />
kitchenware, which it sells through its own outlets. In addition, probably the most far-reaching<br />
development in the changing distribution systems is e-commerce. E-commerce companies, which<br />
are selling table- & kitchenware, tend to offer competitive prices on popular brands, making the<br />
price competition on the table- & kitchenware <strong>market</strong> more intensive. Furthermore, the internet<br />
allows consumers to compare prices of different suppliers. It is obvious that the internet prompted<br />
considerable changes in the trade and distribution systems in the world; but it will not replace the<br />
traditional systems, only add to them.<br />
7.2 Intermediaries<br />
Table- & kitchenwares are distributed through many different channels, partly because they come<br />
in so many different price ranges and functional varieties. Figure 7.1 shows the basic functions of<br />
the various kinds of sales intermediaries, agents, importers, wholesalers and retailers. The thick<br />
lines indicate the most important trade flows.<br />
In general, there are four ways in which products reach the end-consumer. First, manufacturers<br />
can directly supply the consumers. There are many variants on this theme. It could be through<br />
manufacturer-owned brand stores, like the Wedgwood stores. Also, e-commerce offers a direct<br />
link between a manufacturer and the consumer. Other variants are door-to-door selling and partyplan<br />
selling. A brand which is famous for its party-plan selling is Tupperware. Tupperware<br />
organises parties which combine a "ladies’ night out" with tips on cooking and food preparation<br />
with the selling of their products. According to Tupperware, every two seconds a Tupperware<br />
party starts somewhere in the world. These parties offer the company an ideal way to sell their<br />
products.<br />
The second way is called the manufacturer/retailer/end-consumer route. This distribution route is<br />
known as the short channel and is most common in the table- & kitchenware <strong>market</strong>. Because the<br />
retailers’ margins in the table- & kitchenware <strong>market</strong> are quite small, retailers tend to bypass the<br />
wholesalers as much as possible and import or purchase directly from the (domestic)<br />
manufacturers, regardless of whether they are independent retailers or part of a large enterprise.<br />
56
The third option is called the long channel, which implies that products go from the manufacturer<br />
through wholesalers to retailers and finally to the end-consumers. The main advantage of adding<br />
a wholesaler level is that smaller manufacturers do not have to have the resources or skills to<br />
reach a wide range of retailers. The same applies for small retailers; they can buy a diverse range<br />
of products of different brands from the wholesalers, instead of buying small quantities from<br />
different manufacturers. The wholesaler offers a focal point for both sides, by buying in bulk<br />
from manufacturers, then splitting this into manageable proportions for retailers. Wholesalers do<br />
not normally deal with end-consumers but with other intermediaries, usually retailers (see<br />
paragraph 7.3). The wholesaler purchases from manufacturers and takes legal title to the products<br />
as well as taking physical possession of them. He stocks at his own risk. The mark-up of the<br />
wholesaler is approximately 20-30 percent.<br />
In France and Italy, the wholesalers play an important role in the distribution of table- &<br />
kitchenwares. In France, wholesalers make up about one third of the table- & kitchenware sales.<br />
In Italy, there is a major difference between the north and the south, both in social and economic<br />
terms, with the North being much more affluent and brand conscious than the more priceconscious<br />
South. This makes it difficult for large retailers to centralize their purchasing.<br />
Figure 7.1<br />
Trade and distribution channels for table- & kitchenware<br />
Domestic<br />
Manufacturers<br />
Overseas<br />
Manufacturers<br />
Exporters<br />
Agents/ sales offices<br />
Importers<br />
Wholesalers<br />
Retailers (incl. department stores, independents, etc), non-store<br />
retailers (incl. Mail-order, e-commerce, TV-shopping<br />
Consumers<br />
Main distribution flow<br />
Secondary distribution flow<br />
The last variant, adds another intermediary to the distribution chain, namely the agent. This route<br />
is mostly used when a manufacturer tries to enter a relatively unknown export <strong>market</strong>. The agent<br />
is an independent intermediary between the (foreign) manufacturer and the retailer or retail<br />
organisation. The agent has the legal authority to act on behalf of the manufacturer; they do not<br />
take possession of the products. When selling products, they generally receive a commission from<br />
the manufacturer. The agent (or sales representative) covers a limited geographical area. Agents<br />
usually have a good knowledge of distribution structures and of consumer behaviour.<br />
57
The level of the commission depends on a number of factors, including the turnover rate of the<br />
product concerned, but it averages an estimated 5 to 10 percent of turnover. Most agents represent<br />
more than one manufacturer, although competition is avoided. More and more agents are starting<br />
to sell from stock, to meet their clients’ short-term demands.<br />
7.3 Retailers of table- & kitchenware<br />
In the last decade, the European table- & kitchenware retail <strong>market</strong> has undergone a lot of<br />
changes, as an increasing share of products is sold through branch-foreigners. The traditional<br />
retail formats are under pressure from new formats. Grocery multiples nowadays offer a wide<br />
range of table- & kitchenwares. Relatively new retail formats, like for example IKEA, are making<br />
their way into the table- & kitchenware <strong>market</strong>. These factors have led to an increasing<br />
competition amongst the table- & kitchenware retailers.<br />
The retail <strong>market</strong> discussed in this paragraph is<br />
broken down into five channels; grocery<br />
multiples, mixed and independent stores,<br />
department stores, mail-order and other (incl.<br />
catalogue showrooms). Because statistical<br />
information concerning the distribution is not<br />
commonly available, Euromonitor is the only<br />
research agency which collects such data.<br />
However, they do not report them on a yearly<br />
basis. The figures used in this paragraph are<br />
from a forecast made in 1997 for the year 2000.<br />
The figures are outdated; they provide a useful<br />
insight into the different retail channels.<br />
Mixed & independent stores<br />
This category contains a great variety of retail<br />
formats, including independent specialists and<br />
interior design specialists. Furthermore, also<br />
most EU furniture specialists offer a limited<br />
range of table- & kitchenware. The independent<br />
specialists are losing ground because of the<br />
intensive competition. However, in countries<br />
with an underdeveloped infrastructure, these<br />
types of retailers hold strong positions.<br />
Figure 7.2<br />
Other (incl.<br />
catalogue<br />
showrooms)<br />
14%<br />
Grocery<br />
Multiples<br />
21%<br />
Retail channels of table-&<br />
kitchenware in the EU by retail<br />
formats, 2000<br />
Mail-order<br />
4%<br />
Department<br />
St ores<br />
22%<br />
Mixed &<br />
Independent<br />
stores<br />
39%<br />
Source: Euromonitor, 2000<br />
Department stores<br />
Traditionally, department stores were one of the few retailers located in city centres which offer a<br />
wide range of table- & kitchenware. The growth of new formats, like for example IKEA, which<br />
offers an extensive range of cheap products, has put pressure on the <strong>market</strong> share of the<br />
traditional department stores. These more specialised companies have a more modern and<br />
fashionable image. Also, the internet has posed an increasing threat for department stores. Despite<br />
these negative developments, department stores still account for a substantial share of table- &<br />
kitchenware sales. Most department stores offer a wide range of both major brands and private<br />
label. They are mostly situated in the mid- and high-priced segment of the table- & kitchen<br />
<strong>market</strong>.<br />
Grocery multiples<br />
Super<strong>market</strong>s and hyper<strong>market</strong>s are increasingly tapping into the table- & kitchenware <strong>market</strong>.<br />
The influence of cheap imports from Asia and Eastern Europe have increased the possibilities for<br />
the formats like grocery multiples, to sell table- & kitchenwares in their outlets. Super<strong>market</strong>s<br />
mostly offer a limited range of table- & kitchenware, such as mugs and other small household<br />
products. Hyper<strong>market</strong>s however, sell a more comprehensive range of table- & kitchenwares.<br />
58
Both super<strong>market</strong>s and hyper<strong>market</strong>s allow more and more shelf space for non-food articles like<br />
compact discs, table linen, napkins, candles, pots and pans, tableware, cutlery and other kitchen<br />
utensils. According to an article in Tdctrade, this is mainly because non-food products offer better<br />
margins than the standard grocery lines. Furthermore, super<strong>market</strong>s and hyper<strong>market</strong>s mostly<br />
position table- & kitchenware as impulse purchases through cross merchandising with core<br />
grocery items. For example, woks are displayed next to prepared stir-fry vegetables, sauces and<br />
noodles.<br />
Mail-order<br />
This distribution channel only plays a minor role in the sales of table- & kitchenware although in<br />
countries like, for example, France, Germany and the United Kingdom, this channel of<br />
distribution shows substantial sales figures. Mail-order houses send illustrated catalogues of their<br />
merchandise to prospective customers, who can do their shopping at home, rather than visiting a<br />
store. All that has to be done is to fill out an order form and mail it or place the order by<br />
telephone or via the internet and the product(s) are sent to the customers’ home within a couple of<br />
days. Mail-order houses operate mainly in the low and middle ranges regarding price, quality and<br />
design.<br />
E-commerce<br />
In 2002, the EU online spending totalled a<br />
value of € 19.6 billion, which figure will<br />
grow explosively in the near future. The<br />
growing e-commerce <strong>market</strong> will also<br />
trigger the importance of this channel for<br />
the sales of table- & kitchenware. At the<br />
time of writing, there are profound<br />
differences within the selected EU<br />
<strong>market</strong>s. According to Euromonitor,<br />
French retailers sold more than € 50<br />
million online, making France the leading<br />
internet retailer of table- & kitchenwares.<br />
Table 7.1 Internet retail sales of table- &<br />
kitchenware, 2001-2002, in € millions<br />
(excl. cookware, bakeware, etc)<br />
2001 2002<br />
France 28,2 50.6<br />
United Kingdom 4,1 4,8<br />
Italy 0,4 0,4<br />
Germany 2,2 2,4<br />
Spain 0,4 0,8<br />
Netherlands 11,6 17,8<br />
Source: Euromonitor, <strong>2003</strong><br />
Several manufacturers like Richard Ginori and Waterford-Wedgwood are selling their products<br />
directly through the internet. Also, licensed third-parties selling through the internet, is becoming<br />
common practice in the table- & kitchenware <strong>market</strong> nowadays.<br />
Direct <strong>market</strong>ing<br />
Direct <strong>market</strong>ing is rapidly becoming an important method of distribution. A good example of<br />
direct <strong>market</strong>ing is the “selling party”, where manufacturers demonstrate their collections and<br />
where customers can buy directly from the manufacturer. One of the best examples of a brand<br />
which is sold through this method is “Tupperware”. Through the so called Tupperware parties,<br />
the products of this brand are sold. Because of the cost involved in direct <strong>market</strong>ing activities, this<br />
channel is particularly suited for the better quality and more expensive products (See also<br />
Paragraph 7.2).<br />
Others<br />
This channel includes formats like factory outlets, catalogue showrooms and discounters. A few<br />
major manufacturers sell their products through self-owned outlets. These factory outlet centres,<br />
which are already very popular in the USA and in some European countries, like France,<br />
Germany and the United Kingdom, are situated outside the city centre. Here, manufacturers of,<br />
mostly known, brands offer surplus stock, remnants, last year’s collection or products with small<br />
fabrication faults. By leaving out intermediary traders, costs can be reduced for the manufacturer.<br />
For consumers, the factory outlets offer branded table- & kitchenwares at lower prices.<br />
59
Discounters are another important format in this group. These retailers often operate from lowrent<br />
locations. Low-price with no-frills is the most important driver in this concept. This format is<br />
becoming increasingly important. The current recession has been the main trigger for the success<br />
of this type of format.<br />
7.4 Retail channels per country<br />
In this paragraph, we will discuss the different national retail <strong>market</strong>s. Furthermore, the leading<br />
retailers of table- & kitchenware per country are also discussed. This will include national as well<br />
as international companies. According to Euromonitor, the majority of the European table- &<br />
kitchenware retailers are limited to their own national <strong>market</strong> and neighbouring countries. This<br />
group includes retailers like Allders, El Corte Inglés, John Lewis and Vendex. A company which<br />
has achieved an international position is IKEA. Also, some French retailers like Carrefour and<br />
Pinault-Printemps-Redoute have built a more international position.<br />
Figure 7.3 Retail channels of table-& kitchenware in the EU-countries by retail formats, 2000<br />
100%<br />
80%<br />
30%<br />
15%<br />
25%<br />
10%<br />
40%<br />
21%<br />
60%<br />
40%<br />
20%<br />
0%<br />
44%<br />
37%<br />
10%<br />
38%<br />
47%<br />
10%<br />
14%<br />
20%<br />
38%<br />
28% 2%<br />
9%<br />
15% 3%<br />
3% 2%<br />
17%<br />
30%<br />
4%<br />
9%<br />
28%<br />
9%<br />
4%<br />
38%<br />
Hyper<strong>market</strong>s &<br />
Super<strong>market</strong>s<br />
Mixed & Independent<br />
Retailers<br />
Department Stores<br />
Mail-order<br />
Others<br />
France<br />
United<br />
Kingdom<br />
Italy<br />
Germany<br />
Spain<br />
Netherlands<br />
Source: Euromonitor, 2000<br />
France<br />
According to Mintel, France has a mature retail <strong>market</strong>, with a high level of out-of-town<br />
shopping. This is caused by the popularity of hyper<strong>market</strong>s like Carrefour, which has 214 outlets.<br />
In 2001, there were approximately 1.185 hyper<strong>market</strong>s in the whole of France with an average<br />
size of 5,733 square metres. These hyper<strong>market</strong>s are becoming more and more important as retail<br />
outlets for table- & kitchenware. As department stores cannot compete on price, manufacturers<br />
often produce special up-<strong>market</strong> ranges of table- & kitchenwares for department stores and<br />
specialists, and cheaper ranges for hyper<strong>market</strong>s. Large stores specialised in household<br />
equipment such as IKEA and Habitat, are also becoming more popular. This is mainly due to<br />
their wide range of fashionable and good-quality products at reasonable prices. In Table 7.2, you<br />
can see an overview of the most important retailers of table- & kitchenware in France.<br />
60
Table 7.2 France major retailers selling table- & kitchenware, in number of outlets, 2001/2002<br />
Department stores Outlets Furniture stores Outlets Hyper<strong>market</strong>s Outlets<br />
Galeries Lafayette/<br />
80 Conforma 135 Carrefour 214<br />
Nouvelles Galeries But 239 Centres E Leclerc 391<br />
Le Printemps 29 Ikea 12 Auchan 118<br />
Bazar de l' Hotel de Ville 19 Fly 125 Géant 109<br />
Le Bon Marche 1 Discounters<br />
Lidl<br />
959 Super<strong>market</strong>s<br />
Variety stores Aldi Marche 415 Intermarché 1,631<br />
Monoprix/ Prisunic 284 ED 459 Champion 1,003<br />
Tati 30 Leader Price 339 Super U 558<br />
Netto 286 Atac 260<br />
Le Mutant 207 Casino 433<br />
Source: LSA Atlas, 2002/ Panorama-Trade Dimensions, 2002/ Mintel Retail Intelligence, 2002/<br />
Euromonitor, 2002<br />
United Kingdom<br />
The United Kingdom retail <strong>market</strong> for table- & kitchenware is a fiercely competitive <strong>market</strong>. As<br />
in most other EU countries, mixed & independent retailers, hyper<strong>market</strong>s and super<strong>market</strong>s<br />
account for a large share of British table- & kitchenware sales. Hyper<strong>market</strong>s and super<strong>market</strong>s<br />
are prominent in the distribution of table- & kitchenware for every day use. Hyper<strong>market</strong>s and<br />
super<strong>market</strong>s are selling an increasing proportion of table- & kitchenware, like for example<br />
cookware and bakeware. Mail-order houses are also very active in the UK <strong>market</strong> especially in<br />
the sector of cookware, bakeware and the kitchen knives sector.<br />
Table 7.3 United Kingdom’s major retailers selling table- & kitchenware, in number of outlets,<br />
2001/2002<br />
Department stores Outlets Furniture stores Outlets Hyper<strong>market</strong>s Outlets<br />
John Lewis 25 Argos 472 Asda/ Asda-Wal-Mart 245<br />
Debenhams 97 Ikea 11 Tesco Extra 41<br />
House of Frazer 52 MFI Furniture 186 Savacentre 59<br />
Allders 43 Courts 100<br />
Selfridges 2 Super<strong>market</strong>s<br />
Discounters Tesco/ Tesco Metro 613<br />
Variety stores Kwik Save 734 Sainsbury's 384<br />
Marks & Spencer 303 Aldi 250 Safeway 465<br />
Big W/ Woolworths 797 Lidl 290 Morrisons 110<br />
Littlewoods 118 Netto 220 Somerfield 585<br />
Peacocks 312 Iceland 766<br />
Source: Mintel Retail Intelligence 2002/ Euromonitor, 2002<br />
Italy<br />
Italy has an obvious North-South divide in both social and economic terms, with the North being<br />
much more affluent and brand-conscious than the more price-conscious south. The retail business<br />
reflects this divide. Most modern retail developments, like for example hyper<strong>market</strong>s, are located<br />
in the Northern and central part of the country.<br />
The Italian retail <strong>market</strong> is one of the largest in Europe, accounting for more than 700,000 retail<br />
outlets in 2001. This number increased by more than 5 percent in the five-year period between<br />
1997 and 2001. The structure of Italian retail activity is highly fragmented and dominated by<br />
small independent businesses. Mixed & Independent retailers make the lion’s share of the table-<br />
& kitchenware sales. This also explains the importance of wholesalers in Italy. According to<br />
Tdctrade, the <strong>market</strong> is steadily shifting, as multiples like Kasanova, are becoming increasingly<br />
61
important at the expense of these small independent businesses, especially in the Northern part of<br />
the country.<br />
Table 7.4 Italy’s major retailers selling table- & kitchenware, in number of outlets, 2001/2002<br />
Department stores Outlets Furniture stores Outlets Hyper<strong>market</strong>s Outlets<br />
Coin 83 Divani & Divani 130 Ipercoop 52<br />
Il Gigante 8 Chateau d'ax Spa 11 Auchan/ Citta Mercato 35<br />
La Rinascente 17 Ikea 7 Carrefour/GS/Mega Fresco 37<br />
Ferri 287 Mercatone Uno 33 VeGe 50<br />
Regina 45 Super<strong>market</strong>s<br />
Discounters Coop 1,264<br />
Variety stores VeGe 803 Cri/ Sigma 1,234<br />
Upim 146 Lidl 206 Conad 1,540<br />
La Standa 200 In's 196 Carrefour/ GS 301<br />
Ld 211 Sisa 1,500<br />
Di Co 203 A & O 555<br />
Source: Mintel Retail Intelligence, 2002/ Euromonitor, 2002<br />
Germany<br />
In Germany, mixed & independent retailers and department stores make most of the table- &<br />
kitchenware sales. This is mainly because of the greater proportion of up<strong>market</strong> products, such as<br />
bridal gifts, purchased via these outlets. According to research agency Mintel, the German retail<br />
<strong>market</strong> is dominated by domestic groups. This is mainly because of the strength of domestic<br />
groups, high operational costs and restrictions and limitations on trading hours. IKEA and Wal-<br />
Mart are the only two foreign companies which have a significant <strong>market</strong> share of the German<br />
table- & kitchenware <strong>market</strong>. More than 20% of IKEA’s total turnover is earned in Germany.<br />
Germany is also home to the world’s largest mail-order company, the OTTO Trading Group (also<br />
the 2nd largest E-Tailer worldwide).<br />
Table 7.5 Germany’s major retailers selling table- & kitchenware, in number of outlets, 2001/2002<br />
Department stores Outlets Furniture stores Outlets Hyper<strong>market</strong>s Outlets<br />
Alterhaus/<br />
KaDeWe/Karstadt/<br />
350 Ikea 27 Real 277<br />
Wertheim Porta 86 Kaufland/Kaufmarkt 258<br />
Galeria Kaufhof 148 Segmuller 10 Marktkauf 108<br />
Woolworth 358 Mobel Walther 31 Extra 500<br />
Marks & Spencer 2 Super<strong>market</strong>s<br />
Variety stores<br />
Discounters 1,525<br />
HL/ Akzentra/ Minimal/<br />
Aldi 3,560 Rewe-Nahkauf/ Rewe-der<br />
Marktkauf 48 Lidl 2,048 Supermarkt<br />
Emotions/Lust for Life 5 Penny Markt 2,434 E-Aktiv markt/E-frisch/E- 1,490<br />
Kaufcenter/ Kaufhalle/ 11 Plus 2,412 N<strong>eu</strong>kauf/ Edeka Markt<br />
Multistore Norma 1,130 Spar/ Superspar 3,048<br />
Source: Mintel Retail intelligence 2002/ Euromonitor, 2002<br />
Spain<br />
Because of the financial strength and competitive pricing of other retail formats like<br />
hyper<strong>market</strong>s, many small independent retailers in Spain went out of business, which caused the<br />
total number of outlets in Spain to drop by more than 4 percent over the reviewed period. This<br />
trend is forecasted to continue. Hyper<strong>market</strong>s, such as Al Campo and Carrefour, and<br />
super<strong>market</strong>s are increasingly prominent in the distribution of table - & kitchenware for everyday<br />
use. In Spain, these distribution channels accounted for approximately 40 percent of retail sales<br />
by value.<br />
62
Table 7.6 Spain’s major retailers selling table- & kitchenware, in number of outlets, 2001/2002<br />
Department stores Outlets Furniture stores Outlets Hyper<strong>market</strong>s Outlets<br />
El Corte Ingles 50 Ikea 3 Carrefour 113<br />
Aldeasa 178 Merkamuable 3 Alcampo 43<br />
Marks & Spencer 13 Conforma 5 Hiporcor 23<br />
Galerias Tarragona 65 Eroski 33<br />
Variety stores<br />
La Rampa/ Hiper<br />
5 Discounters Super<strong>market</strong>s<br />
Andalucia Dia 2,389 Mercadona 601<br />
Lidl 290 Consum 816<br />
Plus 168 Supersol/Cobreros 623<br />
Zero 74 Caprabo 380<br />
Penny 42 Champion 167<br />
Source: Mintel Retail Intelligence 2002/ Euromonitor, 2002<br />
The Netherlands<br />
Looking at retail developments, the decreasing number of local and independent shops is<br />
significant. Especially large retail formats have pushed the independents out of the <strong>market</strong> place<br />
in favour of their various outlet brands. The main department stores also play an important role in<br />
the distribution of table- & kitchenware. The leading department stores in the Netherlands are<br />
Vroom & Dreesmann (V&D), Hema and Bijenkorf. The latter carries a more sophisticated range,<br />
while Hema sells everyday articles. By tradition, V&D takes a position in the middle; however,<br />
recently a change towards better (and thus more expensive) products can be observed.<br />
Table 7.7 The Netherlands’ major retailers selling table- & kitchenware, in number of outlets<br />
2001/2002<br />
Department stores Outlets Furniture stores Outlets Hyper-/ Super<strong>market</strong>s Outlets<br />
Hema 276 Ikea 11 Albert Heijn 686<br />
Vroom & Dreesmann 69 Leenbakker 100 C1000 509<br />
De Bijenkorf 13 Kwantum 85 Edah 313<br />
Super de Boer 403<br />
Variety stores Discounters Konmar 137<br />
Blokker 473 Aldi 370 Dirk van den Broek 85<br />
Marskramer 197 Basismarkt 187 Plus 123<br />
Xenos 79 Lidl 80 Spar 239<br />
Novalux 102 Dekamarkt 63<br />
Giraffe 36<br />
Hoyng 21<br />
Source: Hoofdbedrijfschap Detailhandel 2001/2002/ Mintel Intelligence 2002/ Euromonitor, 2002<br />
Major multiples, like Xenos, Blokker and Marskramer, also retail a wide range of table- &<br />
kitchenware. According to the Dutch HBD, florists, garden centres and pet shops are also<br />
important sales channels for table- & kitchenware, partly explaining the large share of “others” in<br />
Figure 7.3.<br />
63
7.5 Distribution channels for developing countries exporters<br />
Traditionally, exports deriving from developing countries transit through a set of intermediaries<br />
like agents and importers and in some cases stock-keeping wholesalers, discussed in paragraph<br />
7.2, who in turn <strong>market</strong> the exported products to wholesalers or retailers. These long distribution<br />
lines are mostly caused by the distance between the exporter and his export <strong>market</strong> and, in most<br />
cases, the relatively small size of the production in developing countries. Furthermore, a lack of<br />
information concerning the export <strong>market</strong> makes exporting a hazardous venture. The<br />
disadvantages of working through a large number of intermediaries include poor knowledge of<br />
<strong>market</strong> trends, inability to gain competitive advantage by adapting the product to specific<br />
customer needs and, of course, the margin lost at each stage of the distribution chain.<br />
The most important intermediaries, like agents/ sales offices, importers and retailers, will be<br />
discussed briefly in the next section of this paragraph. See also Figure 7.1, for the different trade<br />
flows.<br />
Agents/ sales offices<br />
Agents are intermediaries who do not keep stocks. The agent may serve as an intermediary<br />
between the manufacturer and the wholesaler or retailer, receiving a commission from the former.<br />
The level of commission depends on a number of factors, including the turnover rate of the<br />
product concerned; it averages an estimated 5 to 10 percent of turnover. Most agents represent<br />
more than one manufacturer. Agents usually have a good knowledge of distribution structures and<br />
consumer behaviour. Some foreign manufacturers have their own sales office in Europe or<br />
elsewhere. This is viable if a manufacturer wants to make sure that his products are properly<br />
advertised and distributed. In fact, only the larger companies, which cover a substantial part of the<br />
<strong>market</strong>, maintain their own offices. The problem of working through an agent is, however, that<br />
the manufacturer is totally dependent and has to trust the quality of the agent's knowledge,<br />
commitment and selling ability.<br />
Importers<br />
Importers are familiar with local <strong>market</strong>s and can supply considerable information and guidance<br />
to the overseas manufacturer, such as the administration of import and export procedures and<br />
holding of stock, in addition to the primary business of buying and selling. Furthermore, they<br />
have strong relationships with suppliers and buyers all over the world. These intermediaries have<br />
long-established links with their customers and are in a better position (than foreign processors)<br />
to know the requirements of the local <strong>market</strong> and of individual end-users.<br />
Retailers<br />
Some large retailers like for example IKEA, also buy table- & kitchenware directly from foreign<br />
suppliers. This may involve intermediary activity by a selling agent on behalf of the manufacturer<br />
or a buying agent on behalf of the (multiple) retailer. This method of doing business has become<br />
more popular, since it cuts out several intermediaries, thus reducing costs and enabling the retailer<br />
to offer the product at a lower end price. It is particularly significant, when a fashion trend takes<br />
hold, with a fierce competition between retailers offering lower prices. Unfortunately, this<br />
method often results in the supply of huge volumes of poorer quality, cheaper merchandise, after<br />
which the demand peaks and then falls off.<br />
Large chains have their own purchasing staff, buying from all over the world. In the country of<br />
origin, most buyers prefer the lines between manufacturer and themselves to be as short as<br />
possible. Short communication lines create a better control over production and deliveries. This<br />
reduces the risk of discrepancies between buyers’ requirements and final product.<br />
64
8 PRICES<br />
Price is an important aspect in the table- & kitchenware sector, but there is such a broad range of<br />
items, qualities, materials, raw materials and styles, that it is almost impossible and not<br />
meaningful to give typical prices. Therefore, this chapter will discuss developments which<br />
influence the price level in the table- & kitchenware <strong>market</strong>. Furthermore, differences in price<br />
levels between EU-countries are examined.<br />
8.1 Price development in the table- & kitchenware <strong>market</strong><br />
As can be seen in Chapters 3 and 4, the table- & kitchenware <strong>market</strong> is becoming increasingly<br />
competitive, due to the pressure of low cost imports from Asia and Eastern Europe. At the same<br />
time, the <strong>market</strong> is shifting away from traditional, formal and mostly high priced products,<br />
towards more casual table- & kitchenware. Manufacturers nowadays introduce new ranges of<br />
fashionable products every year. In addition, existing <strong>market</strong> prices came under pressure due to<br />
the increasing importance of mass-<strong>market</strong> outlets like grocery multiples and discounters selling<br />
low-priced popular table- & kitchenware, in order to create more “traffic”. The above<br />
developments have contributed to an intensified competitive environment. Traditionally, the<br />
table- & kitchenware <strong>market</strong> can be divided into three main price segments:<br />
• Premium-priced table- & kitchenware; consisting of high-quality, formal product brands<br />
like for example Alessi and Villeroy & Boch. These products are mostly sold through<br />
specialty retailers and department stores.<br />
• Mid-priced table- & kitchenware; most of the industry’s volume is realised in this segment.<br />
These products are mostly sold through department stores and retailers.<br />
• Low-priced table- & kitchenware; mostly deriving from Asia or Eastern Europe. These<br />
products are mostly sold through discounters and grocery multiples.<br />
According to branch experts of NPD industry however, the price levels in the table- &<br />
kitchenware <strong>market</strong> are polarizing. Consumers which traditionally shop in the mid-price segment<br />
shift towards the higher priced products called “shopping up”, as quality and specialty are very<br />
important in this segment. The opposite development is also sighted, “shopping down”, meaning<br />
consumers are shopping for lower prices. The latter is triggered by the increasing demand for<br />
low-priced fashionable table- & kitchenware which can be found for example in discounter and<br />
grocery multiples. The increasing amount of cheap products deriving from Asia and Eastern<br />
Europe drove many EU manufacturers out of the low-priced and mid-priced segment. In turn,<br />
many European manufacturers repositioned themselves at the premium end of the <strong>market</strong>, making<br />
this high-priced segment more crowded.<br />
8.2 Price levels in the EU<br />
According to a <strong>survey</strong> issued by Eurostat, concerning the price levels of table- & kitchenware in<br />
the EU, there are profound differences across the EU. The products included in this <strong>survey</strong> are<br />
glassware, ceramicware, cutlery, flatware and silverware.<br />
Figure 8.1 provides a comparison of the price levels with respect to the EU average: if the price<br />
level index is higher than 100, the country concerned is relatively expensive compared with the<br />
EU average. The figure provides an indication of the comparative order of magnitude of the price<br />
level in one country related to another. As can be seen, the price level in the United Kingdom is<br />
relatively high in comparison with the EU average.<br />
65
This can be explained by the fact that the UK is an island, making distribution more difficult and<br />
thus more expensive. In Italy and France the price level is relatively low, partly explained by the<br />
importance of domestic manufacturers and the size of the <strong>market</strong>. An interesting aspect which is<br />
not shown in Figure 8.1, is the relatively high price level of glass & tableware in the<br />
Scandinavian countries like Norway (150), Sweden (171) and Finland (138).<br />
Figure 8.1 Relative price level of table- & kitchenware in selected EU-countries, 2002, EU 15 = 100<br />
140<br />
128<br />
120<br />
100<br />
80<br />
87<br />
83<br />
111<br />
89<br />
101 100<br />
60<br />
40<br />
20<br />
0<br />
France<br />
United<br />
Kingdom<br />
Italy<br />
Germany<br />
Spain<br />
Netherlands<br />
Eu-total<br />
Source: Eurostat, 2002<br />
8.3 Sources of price information<br />
The best way to obtain information about prices and price levels in the EU is by visiting one of<br />
the major trade fairs. Alternatively, comparisons can be found in the prices given in catalogues<br />
from mail-order houses, large department stores and from the internet sites of companies.<br />
Window-shopping in the prospective <strong>market</strong> place, at several retail shops, is another good way of<br />
getting information about prices. Apart from prices, window-shopping gives you a good<br />
impression of the wide variety of products, qualities, fashions, colours and promotions. The<br />
internet is also a good source of price information, for example the IKEA online-store gives<br />
information on retail prices of IKEA products, including its table- & kitchenware.<br />
When setting your price, take into account the different mark-ups as described in paragraph 10.6,<br />
which influence the retail prices. The effect of low, medium and high margins on consumer endprices,<br />
based on one CIF price for three different products in the same category, is illustrated in<br />
Table 10.1.<br />
66
9 REQUIREMENTS FOR ACCESS<br />
9.1 Non-tariff trade barriers<br />
Legislative standards enforced through EU legislation and, possibly, through EU-member<br />
countries increasingly pose obstacles for exporters in developing countries. Although standards<br />
are imposed in order to protect consumers, or the environment, or to improve the harmonisation<br />
of the internal EU <strong>market</strong>, they are often seen as technical, non-tariff barriers to trade. Exporters<br />
must comply with such legislation and regulations in order to be able to export to the European<br />
Union. This means that they have to understand and comply with European legal restrictions.<br />
In this chapter, we will briefly discuss a number of barriers. For detailed information about nontariff<br />
trade barriers relevant to trade, we also refer to the CBI’s AccessGuide, an online database<br />
on European non-tariff trade barriers.<br />
Quality and grading standards<br />
Despite EU harmonization, which enables free trade between EU member states, individual<br />
<strong>market</strong>s have different requirements regarding quality, fabric, standards, size, etc. Accurate<br />
information concerning these requirements is best obtained from national importers. Most of<br />
these importers (manufacturers, wholesalers, retail organisations etc.) also work with certain<br />
minimum requirements. In this respect, they have formulated and stipulated minimum quality<br />
requirements, relating to both materials and manufacturer.<br />
Because this report covers a very wide range of products, it is impossible to give general<br />
guidelines on quality and grading standards for all these different kinds of articles. There are,<br />
however, restrictions on materials used for table- & kitchenware which may come into contact<br />
with food. One important norm is that all articles which come in contact with food should be free<br />
of lead and cadmium. In Table 9.1, the most important restrictions concerning table- &<br />
kitchenware are given. It is however sensible to the check the regulations and standards<br />
concerning your products. Information on regulations can be found on the site of the European<br />
Committee for Standardization. (www.cenorm.be)<br />
Trade-Related Environment, Social and Health & Safety Issues<br />
As conventional trade barriers disappear in the world economy, a new set of concerns is arising.<br />
In recent years, consumer movements in the EU have extended their concerns beyond the<br />
environment to the social impact of business practices. Furthermore, due to the increasing<br />
insistence on certification to meet health and safety standards, new standards for compliance with<br />
environmental management and labour standards are becoming commonplace in most developed<br />
countries’ <strong>market</strong>s.<br />
Environmental issues<br />
Environmental aspects of products have become a major issue in Europe. Besides governmental<br />
actions (legislation and regulation), a strong consumer movement is noticeable, especially in the<br />
northern parts of the EU (Scandinavia, Germany and the Netherlands). As a topic, “the<br />
environment” is more than a trend, it is a lasting one. Due to consumer pressure, the standards<br />
bodies of the developed countries have started the process of adopting “eco-labelling”. To<br />
qualify, manufacturers must be willing to submit their production methods for inspection and<br />
certification. There are several EU eco-labels used in the European Union. There are also a<br />
number of national labels such as the Netherlands Mili<strong>eu</strong>k<strong>eu</strong>r (www.mili<strong>eu</strong>k<strong>eu</strong>r.nl) and the<br />
German Blue angel (www.blauer-engel.de). There is also a European Eco-label called the EU<br />
flower. This is a voluntary scheme enabling European consumers including public and private<br />
purchasers to easily identify officially approved “green” products across the European Union,<br />
Norway, Liechtenstein and Iceland. At present, the EU flower can be awarded to 21 product<br />
groups. This label however does not apply at present to table- & kitchenware.<br />
67
However, new products are added constantly. For more information concerning this topic, we<br />
refer to the Accesguides “Overview of social and environment product labels”<br />
Table 9.1<br />
Different Environmental labels<br />
EU-flower Dutch Mili<strong>eu</strong>k<strong>eu</strong>r German Blue Angel<br />
If a manufacturer wants to indicate to external parties that he is manufacturing in an<br />
environmentally sound way, he can comply with standards which have been developed for this<br />
purpose. A voluntary standard, with which manufacturers can comply, is called the ISO 14000<br />
series. The most important standard in this series is ISO 14001, which sets the requirement for an<br />
environment management system. For detailed information on the ISO standards, we refer to the<br />
AccessGuide “An introduction to the ISO 14000 series.”<br />
Social issues<br />
An increasing consciousness of ethical aspects, encouraged by consumer organisations, has led<br />
importers to develop codes of conduct. The use of child labour in the production of table- &<br />
kitchenware in general is a serious cause for concern in many EU-member countries. Widespread<br />
publicity has raised consumer, but also importers’, awareness of the topic. Exporters who can<br />
guarantee and prove that their products are made without child labour, will not only have a<br />
competitive advantage over other exporters, but will also have a much better chance of<br />
establishing long-term business relationships. In addition, the EU has added a “social clause” to<br />
the Generalised System of Preferences (GSP), which allows for special import tariff reductions<br />
for products that are produced in a humane way.<br />
However, it should be noted, that manufacturers and exporters in developing countries can never<br />
be subject to EU legislation regarding labour conditions. Companies in developing countries only<br />
have to comply with legislation in their home country. However, all products traded in the EU by<br />
importers, are subject to European Union legislation. Social issues are becoming increasingly<br />
important.<br />
The International Federation for Alternative Trade (IFAT) is a federation of manufacturers and<br />
Alternative Trading Organisations (ATO’s). In IFAT, manufacturers of handicrafts and food<br />
products from the developing countries come together directly with buyers and managers of<br />
ATO’s, as friends and partners in a spirit of mutual trust. They cast aside the traditional trading<br />
system of intermediaries and create an alternative way of doing business that is beneficial and<br />
fair. IFAT's objectives are two-fold:<br />
• To improve the living conditions of the poor in developing countries;<br />
• To change unfair structures of international trade.<br />
If your company complies with IFAT’s rules and regulations, you can apply to become a member<br />
of the network. The Fair Trade Organisation (FTO) Netherlands is one of the members of IFAT.<br />
The products, ranging from coffee, other food products such as tea, chocolate, honey and wine, to<br />
some 1,500 handicrafts articles, such as textiles, utensils and decorative items, are purchased<br />
from over 130 producer groups in Latin America, Africa and Asia.<br />
68
In 25 years, fair trade has developed into a serious ‘business’, which is of vital importance to tens<br />
of thousands of manufacturers in Developing Countries. We also refer to the AccessGuide<br />
“Introduction to social issues”<br />
It should be noted that applying these social and environmental standards and labels on a company and<br />
its production can put a lot of strain on an organisation, while the <strong>market</strong> impact in most cases is<br />
limited. An exporter should therefore be aware of what the consequences are for his organisation, when<br />
applying to such labels and standards.<br />
Safety and health issues<br />
When trading into the EU, EU product legislation is very important. All products traded in the<br />
EU, are subject to European Union Norms. One important norm is that all articles which come in<br />
contact with food should be free of lead and cadmium. In Table 9.2, the most important<br />
legislation concerning table- & kitchenware is given. Exporters are strongly advised to check the<br />
exact content of these European norms, since this table only gives an indication of the norms that<br />
exist in this product range. For more detailed information please contact one of the national<br />
institutes for standardisation (see Appendix 4.1 for addresses). Information on these regulations<br />
and standards can also be obtained through the Internet. Useful Internet sites are www.cenorm.be of<br />
the European Committee for Standardization (CEN), and www.iso.ch of the International<br />
Organisation for Standardisation (ISO)<br />
Further information on this topic can be found in the AccessGuide “Introduction to consumer<br />
health and safety”<br />
Table 9.2 European Norms concerning table- & kitchenware<br />
Norm number Title Content<br />
NEN-EN 1900:1998 Materials and articles in<br />
contact with foodstuffs;<br />
Non-metallic tableware;<br />
Defines terms related to certain materials for non-metallic<br />
tableware in contact with foodstuffs. It only includes those<br />
articles composed of the following materials: glass, glass<br />
Terminology<br />
ceramics, porcelain, vitreous china/vitrified tableware,<br />
NEN-ISO 2747:1998<br />
NEN 3032:1966<br />
ISO 6486-1:1999<br />
ISO 6486-2:1999<br />
NEN-EN 1900:1998<br />
Vitreous and porcelain<br />
enamels; Enamelled<br />
cooking utensils;<br />
Determination of<br />
resistance to thermal<br />
shock<br />
Plastics; Specifications<br />
for plastic table ware<br />
Ceramicware, glassceramicware<br />
and glass<br />
dinnerware in contact<br />
with food; Release of<br />
lead and cadmium; Part<br />
1: Test method<br />
Ceramicware, glassceramicware<br />
and glass<br />
dinnerware in contact<br />
with food; Release of<br />
lead and cadmium; Part<br />
2: Permissible limits<br />
Materials and articles in<br />
contact with foodstuffs;<br />
Non-metallic tableware;<br />
Terminology<br />
stoneware, earthenware, common pottery or plastic.<br />
Specifies a method for determining, by successive thermal shock<br />
tests, the behaviour of vitreous and porcelain enamelled cooking<br />
utensils and similar articles under sudden changes of temperature<br />
(resistance to thermal shock).<br />
Material and performance for food and drinking articles made of<br />
plastics.<br />
Specifies a test method for the release of lead and cadmium from<br />
ceramicware, glass-ceramicware, and glass dinnerware intended<br />
to be used in contact with food, but excluding porcelain enamel<br />
articles. Is applicable to ceramicware, glass-ceramicware, and<br />
glass dinnerware which is intended to be used for the<br />
preparation, cooking, serving and storage of food and beverages,<br />
excluding articles used in food manufacturing industries or those<br />
in which food is solid.<br />
Specifies permissible limits for the release of lead and cadmium<br />
from ceramicware, glass-ceramicware and glass dinnerware<br />
intended to be used in contact with food, but excluding porcelain<br />
enamel articles. Is applicable to ceramicware, glass-ceramicware<br />
and glass dinnerware which is intended to be used for the<br />
preparation, cooking, serving and storage of food and beverages,<br />
excluding articles used in food manufacturing industries or those<br />
in which food is solid.<br />
Defines terms related to certain materials for non-metallic<br />
tableware in contact with foodstuffs. It only includes those<br />
articles composed of the following materials: glass, glass<br />
ceramics, porcelain, vitreous china/vitrified tableware,<br />
stoneware, earthenware, common pottery or plastic.<br />
69
ISO 7086-1:2000<br />
ISO 7086-2:2000<br />
NEN-EN-ISO 8442-<br />
1:1998/C1:1999<br />
NEN-EN-ISO 8442-<br />
2:1998/C1:1998<br />
NEN-EN-ISO 8442-<br />
3:1998<br />
NEN-EN-ISO 8442-<br />
4:1998/C2:1999<br />
NEN-EN-ISO 8442-<br />
5:1999<br />
NEN-EN-ISO 8442-<br />
6:2001<br />
Glass holloware in<br />
contact with food;<br />
Release of lead and<br />
cadmium; Part 1: Test<br />
method<br />
Glass holloware in<br />
contact with food;<br />
Release of lead and<br />
cadmium; Part 2:<br />
Permissible limits<br />
Materials and articles in<br />
contact with foodstuffs;<br />
Cutlery and table<br />
holloware; Part 1:<br />
Requirements for cutlery<br />
for the preparation of<br />
food<br />
Materials and articles in<br />
contact with foodstuffs;<br />
Cutlery and table<br />
holloware; Part 2:<br />
Requirements for<br />
stainless steel and silverplated<br />
cutlery<br />
Materials and articles in<br />
contact with foodstuffs;<br />
Cutlery and table<br />
holloware; Part 3:<br />
Requirements for silverplated<br />
table and<br />
decorative holloware<br />
Materials and articles in<br />
contact with foodstuffs;<br />
Cutlery and table<br />
holloware; Part 4:<br />
Requirements for goldplated<br />
cutlery<br />
Materials and articles in<br />
contact with foodstuffs;<br />
Cutlery and table<br />
holloware; Part 5:<br />
Specification for<br />
sharpness and edge<br />
retention test of cutlery<br />
Materials and articles in<br />
contact with foodstuffs;<br />
Cutlery and table<br />
holloware; Part 6:<br />
Lightly silver plated<br />
table holloware protected<br />
by lacquer<br />
Specifies a test method for the release of lead and cadmium from<br />
glass holloware which is intended to be used in contact with<br />
food. Is applicable to glass holloware intended for use in the<br />
preparation, cooking, serving and storage of food and beverages,<br />
excluding glass ceramicware, glass flatware, and all articles used<br />
in food manufacturing industries or those in which food is sold.<br />
Specifies permissible limits for the release of lead and cadmium<br />
from glass holloware which is intended to be used in contact<br />
with food. Is applicable to glass holloware intended for use in the<br />
preparation, cooking, serving and storage of food and beverages,<br />
excluding glass ceramicware, glass flatware, and all articles used<br />
in food manufacturing industries or those in which food is sold.<br />
Specifies material and performance requirements and test<br />
methods for metal cutlery and related implements intended for<br />
use in the preparation of food. Two grades of cutlery are<br />
specified: - a normal grade with corrosion resistant blades or<br />
prongs capable of withstanding dishwasher cleaning procedures;<br />
- a special grade with corrosion resistant blades capable of<br />
withstanding dishwasher cleaning procedures and sterilization<br />
processes.<br />
Specifies material, performance requirements and test methods<br />
for table cutlery (knives, forks, spoons, carving sets, ladles,<br />
children's cutlery and other serving pieces). This standard is<br />
applicable to stainless steel cutlery and to silver-plated nickel<br />
silver, or silver-plated stainless steel, cutlery. It does not cover<br />
cutlery made wholly of precious metals, aluminium, nonstainless<br />
steel or that made entirely of nickel silver, nor does it<br />
cover gold-plated or chromium-plated cutlery. Three minimum<br />
thicknesses of silver are specified for silver-plated cutlery.<br />
Specifies material, performance requirements and test methods<br />
for silver-plated table and decorative holloware made principally<br />
from metals, and intended for use at or upon the dining table.<br />
Composition limits are specified for the basic metals for<br />
fabrication of the holloware prior to silver-plating.<br />
Specifies the following requirements for gold plated cutlery: a)<br />
performance requirements for table cutlery (for example, knives,<br />
forks, spoons, carving sets, ladles, and other serving pieces); b)<br />
composition limits for base metals for cutlery; c) tests for<br />
resistance to permanent deformation, firmness of handle<br />
attachment, hardness of blades, resistance to corrosion and the<br />
thickness and adhesion of gold coatings; d) three minimum<br />
thicknesses of gold plating: a first class, a second class, and a<br />
third class. Specifies the method of defining gold deposits for<br />
each and every item and also test methods. Does not apply to<br />
table cutlery which has only small areas of gold plate as inlays in<br />
non gold plated decoration.<br />
Specifies the sharpness and edge retention of knives which are<br />
produced for professional and domestic use in the preparation of<br />
food of all kinds, specifically those knives intended for hand use<br />
Specifies material and performance requirements for table and<br />
decorative holloware, and cast attachments, made from metals<br />
which are lightly silver-plated and protected by lacquer. Is<br />
applicable to such items as jugs, dishes, wine coolers, tea- and<br />
coffee-pots, trays and tureens, and includes decorative items such<br />
as vases, trophies, and candlesticks. Requirements are specified<br />
for brass, copper, nickel-silver, pewter and stainless steel<br />
holloware with a light silver-platting and a lacquered coating.<br />
Composition limits are specified for the basic metals for<br />
fabrication of the holloware prior to silver-plating and<br />
lacquering.<br />
70
NEN-EN-ISO 8442-<br />
7:2001<br />
NEN-EN-ISO 8442-<br />
8:2001<br />
NEN-EN 12156:1995<br />
NEN-EN 12983-<br />
1:2000<br />
NVN-ENV<br />
13834:2000<br />
Materials and articles in<br />
contact with foodstuffs;<br />
Cutlery and table<br />
holloware; Part 7:<br />
Specification for table<br />
cutlery made of silver,<br />
other precious materials<br />
and their alloys<br />
Materials and articles in<br />
contact with foodstuffs;<br />
Cutlery and table<br />
holloware; Part 8:<br />
Specifications for silver<br />
table and decorative<br />
holloware<br />
Materials and articles in<br />
contact with foodstuffs;<br />
Cutlery and table<br />
holloware; Lacquered<br />
lightly silver-plated table<br />
and decorative holloware<br />
Cookware; Domestic<br />
cookware for use on top<br />
of a stove, cooker or hob;<br />
Part 1: General<br />
requirements<br />
Cookware; Ovenware for<br />
use in conventional<br />
domestic ovens<br />
Specifies material and performance requirements for table,<br />
cutlery made of precious metals and their alloys, esp. silver<br />
(knives forks, spoons, carving sets, ladies and other pieces).<br />
Specifies material, performance and marking requirements for<br />
silver table and decorative holloware, intended for use at or upon<br />
the dining table. This standard extends to decorative items such<br />
as vases, candlesticks and trophies and includes such items as<br />
jugs, dishes, tea- and coffee-pots, trays and tureens, wine-coolers<br />
etc.<br />
Specifies material and performance requirements for table and<br />
decorative holloware, and cast attachments, made from metals<br />
which are lightly silver-plated and protected by lacquer. This<br />
standard is applicable to such items as jugs, dishes, wine collers,<br />
tea- and coffee-pots, trays and tueens, and includes decorative<br />
items such as vases, trophies, candlesticks. Requirements are<br />
specified for brass, copper, nickel-silver, pewter and stainless<br />
steel holloware with a light silver-plating and a lacquered<br />
coating. The standard does not cover holloware made entirely of<br />
precious metals, brass, nickel-silver, stainless steel or made from<br />
ceramics or glass or non-stainless steel or zinc-based die cast.<br />
Composition limits are specified for the basic metals for<br />
fabrication of the holloware prior to silver-plating and<br />
lacquering. The standard does not include requirements for<br />
design, size or any other characteristics which are matters of<br />
personal choice or which can be readily assessed by the<br />
purchaser at the point of sale.<br />
Specifies safety and performance requirements for items of<br />
cookware for domestic use on top of a stove, cooker or hob. Is<br />
applicable to all cookware regardless of material or method of<br />
manufacture with the exceptions of those mentioned below. Is<br />
also applicable to cookware intended for use both "on top" and<br />
"in oven". Is not applicable to glass, ceramic and glass ceramic<br />
articles. The applicability of this standard and possible additional<br />
requirements and test procedures for these products are under<br />
consideration and are intended to be incorporated in a<br />
complementary standard. This standard is not applicable to<br />
pressure cookers, stove-top water kettles and coffee makers.<br />
Requirements and test procedures for resistance to pull of<br />
furniture, non stick coatings, suitability for various heat sources<br />
and suitability for use in automatic dishwasher are under study<br />
and will be covered by a complementary standard.<br />
Specifies safety and performance requirements for items of<br />
ovenware for use in domestic ovens. It is applicable to all<br />
ovenware regardless of material or method of manufacture. It is<br />
applicable to products intended for use both 'on top of the stove'<br />
and 'in oven'.<br />
Source: N.E.N., <strong>2003</strong><br />
Working circumstances<br />
Information on labour conditions can be obtained from the International Labour Organisation<br />
(ILO) which is the UN organisation dealing with all aspects of work; the internet site can be<br />
found in Appendix 4.5. To give an idea of the implications of occupational health and safety we<br />
refer to Appendix 8<br />
71
Packaging<br />
According to the CBI export planner, packaging serves three basics functions:<br />
• It protects your product during transportation<br />
• It breaks down your product to sellable units (e.g. transforming staple goods into<br />
consumer units), or simply makes the product easily accessible to consumers<br />
• It conveys a message to the buyer/consumer (marking and labelling)<br />
Products deriving from developing countries generally have a long distance to travel before<br />
reaching their destinations in the EU. Therefore, it is very important that close attention is paid to<br />
packaging of products. Good packaging protects products from, for example, the fluctuations and<br />
extremes of temperature, relative humidity, vibration and shock, impact, getting wet, theft and<br />
getting lost.<br />
Depending on the choice of distribution channel, both the outer and the consumer packing should<br />
be adapted to the demands of the importers/retailers and the consumer. Most distributors place<br />
strong emphasis on attractive, easy-to-handle, and self-promoting packing materials. Packing in<br />
sturdy corrugated boxes with dimensions enabling easy handling and weight (not exceeding 25 kg<br />
per carton) is recommended. Wherever possible, the outer cartons should be placed together on<br />
pallets, to further avoid the risks of damage during transit.<br />
Attractive consumer packing is important, especially for articles in the middle and higher price<br />
bracket. The exclusiveness of higher priced items of original value can be underlined by special<br />
packing - in elegant display boxes - in style with the design of the product. The consumer packing<br />
should attract attention, clearly show the contents - either by picture or by see-through packing -<br />
and contains information on the use of the product. In other words, the packing should match the<br />
design, image, quality and price of the product. Attractive consumer packing is definitely a sales<br />
argument.<br />
Packing of china, porcelain, ceramicware and glassware<br />
Products made of such materials are prone to damage. Careless packing can result in breakage<br />
and chipping. To minimise such risks, these articles ought to be carton-packed. The pre-packed<br />
articles should then be put in corrugated boxes. Cushioning for protection is advisable.<br />
Packing of metalware<br />
Usually these products can be shipped and transported in carton boxes without great risks of<br />
damage. Even though these articles are not very liable to break, they do run a risk of becoming<br />
dented or scratched. This may be easily avoided by wrapping each individual article in soft paper<br />
or by giving it a layer of cushioning material.<br />
Packing of woodware and plasticware<br />
Like metalware, these items are prone to scratches. To prevent scratches as much as possible, it is<br />
recommended to wrap every article in soft paper or any other cushioning material.<br />
EU standards for packaging and packaging waste<br />
To harmonise the different forms of legislation on packaging and packaging waste in EU<br />
countries, the EU has issued the directive 94/62/EC, which regulates minimum standards. With<br />
effect from August 1, 2001, these minimum standards will require a recovery quota of 50-65<br />
percent for packaging materials brought into the <strong>market</strong> and will regulate the presence of four<br />
heavy metals (mercury, lead, cadmium and hexavalent chromium). EU-member countries have a<br />
certain freedom in how to comply with the recovery rate but at least 25-45 percent of the material<br />
brought on to the <strong>market</strong> must be recycled, with a minimum of 15 percent for each material. The<br />
maximum available sum of concentrations of lead, mercury and hexavalent chromium in<br />
packaging is 100 parts per million.<br />
72
These standards have been implemented by the EU-member countries since 1996 and are now in<br />
force in most of them. Each country reserves the right to apply additional standards, as long as<br />
these do not hamper trade between countries. For more detailed information on packaging we<br />
refer to the different CBI’s AccessGuides.<br />
Marking and labelling<br />
Marking and labelling serves two major purposes. First, it is critical for smooth distribution<br />
through the transport system. The labels should state the originating and destination addresses, as<br />
well as contact names and telephone numbers. Secondly, marking and labelling gives information<br />
concerning the product.<br />
Appropriate labels should be attached to indicate, for example, that items are fragile and that they<br />
need to be kept upright. Without attaching these labels, the people handling the objects and crates<br />
will not be aware they have to be careful. It is important to label individual parcels and packages<br />
within crates as well. Large warehouses, department stores and super<strong>market</strong>s in Europe do not<br />
have the time to open each individual package to check the contents. Each package should<br />
therefore be properly labelled with codes, stating both the contents and the article code of the<br />
buyer/distributor. More than elsewhere, the use of the pictorial marking “FRAGILE” seems<br />
appropriate for china & porcelain, glassware and ceramicware. In Table 9.3, a number of labels<br />
which apply to table- & kitchenware are given.<br />
Table 9.3<br />
Different labels which can apply for table- & kitchenware<br />
Keep dry This way up Fragile<br />
The second reason for marking and labelling is to inform the consumers about the product.<br />
Today’s consumer wants to know exactly what he or she buys. Therefore, it is important to mark<br />
the product’s brand name, special materials, name/sign of the artisan and guarantee of originality,<br />
according to the <strong>market</strong> segment for which the product is intended. A label on the article has to<br />
provide the necessary data in a language comprehensible for the target <strong>market</strong>. In general, the<br />
label should state material(s) used, qualities, country of origin and, if applicable, size in<br />
centimetres or volume in litres, instructions for use. Moreover, labels and package can both be<br />
used for sales promotion of other articles of the manufacturer in the same category. Positive sales<br />
arguments, which should be indicated on the product if applicable, are environmentally friendly,<br />
produced from recyclable material, food-safe.<br />
73
Sometimes symbols are used to indicate the qualities of the product, such as food-safe,<br />
recyclability, dishwasher-safe, microwave-safe, etc. The essential data can be printed on the<br />
underside of the product. On, for example, porcelain or ceramicware you should mark whether or<br />
not it is safe to put the product in the dishwasher and / or microwave.<br />
Barcodes<br />
Below in this table, you will see a barcode, which helps importers and<br />
wholesalers to enter the information concerning products in their<br />
computer automatically. Information concerning products is put down<br />
on a label in a number of thick and thin lines. In addition, the barcode<br />
shows a number of digits consisting of four groups. The first two<br />
numbers indicate the country of the manufacturer. The second group of<br />
digits stand for the manufacturer. The third group matches the product<br />
number. The last number is for control, it helps prevent mistakes<br />
occurring. It is not compulsory to use barcodes, nevertheless an<br />
increasing share of producers make use of these codes, making it easier<br />
to keep information concerning your stock. Secondly, it helps to trace<br />
your products.<br />
9.2 Tariffs and quota<br />
All EU-countries apply common customs tariffs to imports from outside the Union. If there is no<br />
special trade agreement in force, the general import tariff applies, as shown in Table 9.5. Some<br />
kind of preferential trade agreement in the field of tariffs and reductions of EU duty levels may<br />
apply to many developing countries, according to the commitments in the Uruguay Round, until<br />
2005. Most of the developing countries are granted special trade preferences; these countries<br />
usually benefit from zero duties through preferential treatment under the Generalised System of<br />
Preferences (GSP) or under the fourth Lomé Convention for the African, Caribbean and Pacific<br />
(ACP) countries.<br />
Both Lomé and GSP are preferential trade regimes, which provide benefits to developing nations<br />
under certain conditions. In the case of manufactured goods, the products must meet specified<br />
criteria concerning adding value or processing in the exporting nation, in order to receive<br />
preferential treatment. If these conditions are not met, the preferential trade regime will not apply<br />
to the particular export.<br />
Generalised System of Preferences<br />
This agreement allows products originating from<br />
the countries concerned to be imported at<br />
preferential tariffs or duty-free for the least<br />
developed countries. A “Certificate of Origin<br />
Form A” has to be filled in by the exporter and<br />
issued by the competent authorities. Tariff<br />
contingents and tariff ceilings do not exist<br />
anymore. The GSP does not apply to countries<br />
producing table- & kitchenwares in large<br />
quantities, like for example China and Thailand.<br />
A list of countries falling under the GSP is<br />
found in Appendix 7.<br />
To obtain an exemption from import duties, the<br />
goods must be accompanied by an original<br />
Certificate of Origin, issued by the assigned<br />
authority in the country of origin.<br />
• For ACP countries, this has to be the EUR.<br />
1 Certificate.<br />
• For countries under the Generalised<br />
System of Tariff Preferences, this has to be<br />
a Form A certificate.<br />
Furthermore, the condition has been imposed<br />
that the products come directly from the<br />
country of origin.<br />
74
Lomé Convention<br />
Products originating from ACP countries can be imported without duties, when a “Movement<br />
Certificate EUR. 1” is filled in by the exporter and issued by Customs in the country of export. A<br />
list of countries falling under the Lomé Convention is found in Appendix 6.<br />
TARIC: Information concerning custom tariffs can be found in the Taric database at<br />
www.<strong>eu</strong>ropa.<strong>eu</strong>.int/comm/taxation_customs/. TARIC is an acronym for Tarif Intégré de la<br />
Communauté created at the same time as the Combined Nomenclature (CN). The TARIC contains a<br />
nomenclature in 11 official languages. It shows all third country and preferential duty rates actually<br />
applicable as well as commercial policy measures.<br />
Value added taxes<br />
Member countries of the European<br />
Union levy their own tax from<br />
consumers. These Value Added Taxes<br />
(VAT) rates differ and are shown in<br />
Table 9.4. Rates within the EU will<br />
gradually be harmonized. Between EU<br />
members there is free movement of<br />
goods. With the single European<br />
<strong>market</strong>, no VAT is levied on trade<br />
between EU member countries.<br />
Table 9.4 VAT Tariffs EU-member countries<br />
Country VAT-rate Country VAT-rate<br />
Austria 20% Italy 20%<br />
Belgium 21% Luxembourg 15%<br />
Denmark 25% The Netherlands 19%<br />
Finland 22% Portugal 19%<br />
France 19,6% Spain 16%<br />
Germany 16% Sweden 25%<br />
Greece 18% United Kingdom 17,5%<br />
Ireland 21%<br />
Source: EVD (2002)<br />
Up-to-date information on import tariffs can be obtained from the TARIC database of the<br />
European Union (www.<strong>eu</strong>rope.<strong>eu</strong>.int). The HS code of the product concerned must be always<br />
mentioned; a detailed list of HS codes can be found in Appendix 1 of this <strong>survey</strong> as well. Other<br />
information sources are the European Commission, trade associations and importers.<br />
Table 9.5 Import duties on table- & kitchenware, 01-01-2004<br />
General Developing Least Excluded from<br />
Tariffs Countries Developed preferences<br />
Countries<br />
Plasticware 39241000 6.5 0 0 China (3.2)<br />
39249090 6.5 0 0 China (3.2)<br />
39249019 6.5 0 0 China (3.2)<br />
Woodware 44190000 0 0 0<br />
44190010 0 0 0<br />
44190090 0 0 0<br />
China & Porcelain 66111000 12.0 8.4 0 ex. Myanmar, China<br />
69119000 12.0 8.4 0 ex. Myanmar, China<br />
Ceramicware 69120010 5.2 1.5 0 ex. Myanmar, China<br />
691<strong>2003</strong>0 5.5 2.5 0 ex. Myanmar, China<br />
69120050 9 5.5 0 ex. Myanmar, China<br />
69120090 7 3.5 0 ex. Myanmar, China<br />
Glassware 70131000 11 7.5 0 ex. Myanmar, China<br />
70132111 11 7.5 0 ex. Myanmar, China<br />
70132119 11 7.5 0 ex. Myanmar, China<br />
70132191 6.5 0 0 China (3.2)<br />
70132199 11 7.5 0 ex. Myanmar, China<br />
70132910 11 7.5 0 ex. Myanmar, China<br />
70132951 11 7.5 0 ex. Myanmar, China<br />
70132991 11 7.5 0 ex. Myanmar, China<br />
70132999 11 7.5 0 ex. Myanmar, China<br />
70133110 11 7.5 0 ex. Myanmar, China<br />
70133190 11 7.5 0 ex. Myanmar, China<br />
70133200 11 7.5 0 ex. Myanmar, China<br />
75
70133910 11 7.5 0 ex. Myanmar, China<br />
70133991 11 7.5 0 ex. Myanmar, China<br />
70133999 11 7.5 0 ex. Myanmar, China<br />
70139110 11 7.5 0 ex. Myanmar, China<br />
70139190 11 7.5 0 ex. Myanmar, China<br />
70139900 11 7.5 0 ex. Myanmar, China<br />
70139910 11 7.5 0 ex. Myanmar, China<br />
70139990 11 7.5 0 ex. Myanmar, China<br />
Metalware 73239100 3.2 0 0 ex. China<br />
73239200 3.2 0 0 ex. China<br />
73239310 3.2 0 0 ex. China<br />
73239410 3.2 0 0 ex. China<br />
73239490 3.2 0 0 ex. China<br />
73239910 3.2 0 0 ex. China<br />
73239991 3.2 0 0 ex. China<br />
73239999 3.2 0 0 ex. China<br />
74170000 4 0 0 ex. China<br />
74181900 3 0 0 ex. China<br />
76151910 6 2.5 0 ex. Myanmar, China<br />
76151990 6 2.5 0 ex. Myanmar, China<br />
Cutlery 82111000 8.5 2.9 0 ex. Myanmar, China<br />
82119130 8.5 2.9 0 ex. Myanmar, China<br />
82119180 8.5 2.9 0 ex. Myanmar, China<br />
82119190 8.5 2.9 0 ex. Myanmar, China<br />
82119200 8.5 2.9 0 ex. Myanmar, China<br />
82119290 8.5 2.9 0 ex. Myanmar, China<br />
82119300 8.5 2.9 0 ex. Myanmar, China<br />
82119390 8.5 2.9 0 ex. Myanmar, China<br />
82119400 6.7 2.3 0 ex. Myanmar, China<br />
82151010 4.7 1.2 0 ex. Myanmar, China<br />
82151020 4.7 1.2 0 ex. Myanmar, China<br />
82151030 8.5 2.9 0 ex. Myanmar, China<br />
82151080 4.7 1.2 0 ex. Myanmar, China<br />
82151090 4.7 1.2 0 ex. Myanmar, China<br />
82152010 8.5 2.9 0 ex. Myanmar, China<br />
82152090 4.7 1.2 0 ex. Myanmar, China<br />
82159100 4.7 1.2 0 ex. Myanmar, China<br />
82159910 8.5 2.9 0 ex. Myanmar, China<br />
82159990 4.7 1.2 0 ex. Myanmar, China<br />
Source: TARIC database, EU<br />
After having read Part A of this <strong>survey</strong>, it is important for an exporter to analyze the target<br />
<strong>market</strong>s, sales channels and potential customers in order to formulate <strong>market</strong>ing and product<br />
strategies. Part B subsequently aims to assist (potential) exporters from developing countries in<br />
their export-decision-making process.<br />
76
PART B<br />
EXPORT MARKETING GUIDELINES: ANALYSIS AND<br />
STRATEGY<br />
77
10 EXTERNAL ANALYSIS<br />
How do you get involved in the international <strong>market</strong>place How much time and money will it<br />
take Should you make exporting part of your business plan These are common concerns of<br />
manufacturers who are aware of the importance of international trade, but have made no decision<br />
yet whether to start exporting. Part B of this <strong>market</strong> <strong>survey</strong>, helps you evaluate whether to get<br />
involved in international business.<br />
Chapters 10 and 11 aims to assist potential exporters in the decision-making process about<br />
whether or not to export. In Chapter 10, the external analysis will assist you to identify suitable<br />
export products, target countries, <strong>market</strong> segments, and possible trade channels. In Chapter 11,<br />
the internal analysis will assist you to assess, to which extent your company is capable of taking<br />
advantage of the opportunities identified in the external analysis. By matching opportunities with<br />
the company’s capabilities, the exporter will obtain a first impression of the potential of the<br />
<strong>market</strong> initially chosen. This will be handled in Chapter 12. Subsequently, Chapter 13 describes<br />
the <strong>market</strong>ing tools, which can be used to build a successful business relationship. The<br />
information provided in the previous parts of this <strong>survey</strong> is an essential ingredient in conducting<br />
the analysis and formulating a well-defined export strategy. Where applicable, reference will be<br />
made to the relevant sections in Parts A and B.<br />
For general information on export <strong>market</strong>ing and how to conduct <strong>market</strong> research, please refer to<br />
CBI's “Export Planner” and CBI's “Your guide to <strong>market</strong> research”.<br />
10.1 Market developments and opportunities<br />
As a first step towards the identification of the most suitable export <strong>market</strong>s, the exporter needs to<br />
research the importance of potential <strong>market</strong>s and understand the ongoing developments that shape<br />
the EU table- & kitchenware <strong>market</strong>. The <strong>market</strong> information described in part A of this <strong>market</strong><br />
<strong>survey</strong> can be very useful as a starting point for your export <strong>market</strong> research. Part A of this<br />
<strong>market</strong> <strong>survey</strong> gives you insight in the different EU-<strong>market</strong>s. Information is given concerning the<br />
following topics: <strong>market</strong> growth, competitors, import, export and distribution channels.<br />
Questions an exporter should pose:<br />
• Market size/ development: What is the (estimated) <strong>market</strong> size for your potential export<br />
products Is there a positive or a negative development, in terms of expenditure per capita, margins<br />
etc. (See Chapter 3)<br />
• Trends: What sorts of products are selling well What colours are in fashion What new designs<br />
are popular If there is no information on your specific product varieties, then try to obtain<br />
information on the development of <strong>market</strong>s for related products (See Chapter 3)<br />
• Imports: How have imports developed during the last 3-5 years (See Chapter 5)<br />
• Which sales channel is most suitable for your range of products (See Chapter 7 and 10.3)<br />
• What standards or requirements apply to the quality of your product and are these standards<br />
compulsory (See Chapter 9)<br />
• What standards apply to the quality of your company’s management and production (ISO)<br />
• Are there any labels (e.g. ECO labels, etc.) which create a competitive advantage (See Chapter 9)<br />
• Are there environmental regulations or requirements on the use of dangerous substances for<br />
your product(s) (See Chapter 9)<br />
• What special legislation must be complied with regarding health and safety issues (e.g. CE<br />
norms)<br />
• Which import tariffs & VAT duties apply to your export products (See Chapter 9)<br />
78
In Chapter 9, the requirements for accessing the EU-<strong>market</strong> are discussed, including packaging,<br />
quality, non-tariff barriers, environmental and social issues. As Chapter 9 of this <strong>survey</strong> has<br />
already shown, the European <strong>market</strong> (department stores, specialized shops, etc.) sets high<br />
demands on quality. Furthermore, a wide array of non-tariff barriers that could be applicable to<br />
exporters of table- & kitchenware were described in that same section. It is important to<br />
determine which standards and regulations apply to your situation. For example, when you are<br />
producing utilities which come in to contact with food, you are also subject to European Union<br />
Health & Safety Norms. Keep in mind that regulations and standards are continuously changing.<br />
Therefore, it is recommended to check the up-to-date situation with importers or the relevant<br />
organisations.<br />
Doing research<br />
Conducting a systematic <strong>market</strong> search takes time, but normally pays off in the long run.<br />
Consideration at the outset of the factors involved with exporting, will help to save you from<br />
misfortunes and unexpected costs later on. The two types of <strong>market</strong> research most businesses<br />
conduct are primary and secondary <strong>market</strong> research. In conducting primary <strong>market</strong> research,<br />
businesses collect data directly from the foreign <strong>market</strong>place, initiating phone interviews and<br />
<strong>survey</strong>s, and directly contacting potential customers and representatives. Because it is tailored to<br />
a specific company and product, primary <strong>market</strong> research is time-consuming and expensive. As a<br />
result, most small businesses begin researching their <strong>market</strong>s using secondary <strong>market</strong><br />
information. Secondary <strong>market</strong> research entails the collection of data from a number of resources<br />
including:<br />
• International news reports (televised, in print and on-line)<br />
• Trade associations, for websites see Appendix 4.2<br />
• Trade journals (like for example ‘Tableware International’, a leading journal on<br />
international table- & kitchenwares.<br />
• Trade press, providing a good indication of products which are in fashion; for websites<br />
see Appendix 4.4.<br />
• Research agencies, national and international: Euromonitor and Mintel, two important<br />
European research agencies; for websites see Appendix 4.5<br />
• Trade Agencies, like for example the Dutch CBI, the German GTZ and ITC; for<br />
websites see Appendix 4.5<br />
• Trade fair organisers, good indicators for new trends and developments; for websites<br />
see Appendix 4.3.<br />
• Trend-setting international companies like for example Alessi and Villeroy & Boch.<br />
Furthermore, important fashion companies like DKNY and Benetton give a good insight<br />
in new colour trends.<br />
• The CBI’s “Colour trends 2004/06”, giving an indication of coming trends and colours.<br />
Generally, exporters use all of these resources, and conclude by confirming and gathering<br />
additional information from specialists at the above agencies. The internet is one of the most<br />
important ways in which an exporter can obtain <strong>market</strong> information. Buying or commissioning<br />
<strong>market</strong> research reports can be (prohibitively) expensive. For a fraction of the cost and, in many<br />
cases, free of charge, much of the same information can be gathered from the Internet. The<br />
volume of relevant international <strong>market</strong>ing information available on the Web is too extensive to<br />
describe in detail in this <strong>survey</strong>. However, through search engines like, for example, Google<br />
(www.google.com) and Yahoo (www. yahoo.com), useful information on different topics can be<br />
acquired. Sites of the different trade fair organisers offer extensive information on coming trends<br />
in the table- & kitchenware sector. Furthermore you can browse the sites of different competitors<br />
for a good indication of the <strong>market</strong> (See Chapter 4).<br />
79
Successful companies start with:<br />
• searching the <strong>market</strong>;<br />
• checking <strong>market</strong> requirements;<br />
and produce thereafter, instead of the other way round. This advice can save you a lot of trial and error<br />
and, in short, prevent you from wasting money and time!<br />
Unfortunately, most manufacturers start exporting by trying to sell what they have. They adapt their<br />
products and <strong>market</strong> approaches only after they have found out certain defects and/or problems.<br />
Matching your products and <strong>market</strong>ing approaches with the <strong>market</strong>’s needs and wants beforehand, can<br />
give you a flying start!<br />
10.2 Competitive analysis<br />
After having identified a potentially interesting<br />
export <strong>market</strong>, it is important to know whether<br />
your company and its products can compete<br />
with the other suppliers in that <strong>market</strong>.<br />
Competitors and their pricing will have a direct<br />
effect on the potential success of your trade<br />
opportunities. To learn more about your<br />
competitors, research is very important. This<br />
<strong>survey</strong> offers you a good start. Chapter 4 of this<br />
<strong>market</strong> <strong>survey</strong> gives some insights in important<br />
manufacturers per product group. In Chapter 5,<br />
the main suppliers of the EU-member countries<br />
are discussed. Also take note of the import<br />
statistics in Appendix 2.<br />
Questions an exporter should pose:<br />
• Who are the raw materials suppliers and<br />
manufacturers in your primary <strong>market</strong>s<br />
(Check Chapters 4 and 5)<br />
• Is there much competition in these<br />
<strong>market</strong>s<br />
• What sort of competitive products are on<br />
offer<br />
• What are the strengths and weaknesses of<br />
your main competitors<br />
• How many competitors from your own<br />
country are active in the target <strong>market</strong><br />
When looking at the potential <strong>market</strong>, the following questions should be kept in mind.<br />
A. What products compete with yours<br />
Prepare a list of all the competition and then highlight who your main competitors (national and<br />
international) are. To learn more about competition, you can do a secondary research study<br />
regarding your industry and ask customers and suppliers for their opinions.<br />
B. Who are the suppliers or manufacturers of those products<br />
In most European countries, the products must carry the name of the manufacturer or importer.<br />
Register the names. What do you know about them Are they small or do they belong to a<br />
multinational If possible, visit competing companies at trade fairs to learn how products are<br />
priced and distributed. You can prepare a list of your main competitor’s strengths and<br />
weaknesses.<br />
C. Assess the competitors’ prices<br />
Price is one of the main motives for buying - next to design, uniqueness and quality. You will<br />
find that your potential buyers will force you into price-fighting with competing suppliers.<br />
Consequently, your price-setting largely depends on the competitors’ prices.<br />
D. Discover where and how the competition is selling their products<br />
You need to find out which trade channels are used by your competitors, and why. Trade fairs are<br />
a useful place to get to know information about your competitors and their products.<br />
80
E. Observe activities in the branch<br />
Several activities like trade fairs, congresses and seminars can be helpful for making contact with<br />
new customers and/or learning about <strong>market</strong> developments. It can also be used to find out more<br />
about your competition.<br />
Looking at your competitors’ products is just the first step into understanding their strong and<br />
weak points. Now you should try to understand their <strong>market</strong> position in order to predict how they<br />
will react on your <strong>market</strong> approach.<br />
10.3 Sales channel assessment<br />
Distribution - the mechanism through which your goods eventually reach the buyer – can be<br />
distinguished in the physical as well as the non-physical sense. Physical distribution describes the<br />
actual transportation of the goods from your factory or warehouse via the intermediaries to the<br />
end users. In that respect, transportation costs, packaging and carriers are relevant. As such,<br />
physical distribution is the downstream element of the art of logistics, which describes the flow of<br />
goods from its natural sources through the processing stage in your factory all the way down to<br />
the end-consumer. This part will be discussed in paragraph 10.5.<br />
In this paragraph, the non-physical (indirect)<br />
distribution is described, explaining which sales<br />
channels (importers, wholesalers, retailers,<br />
department stores, super<strong>market</strong>s etc.) to choose.<br />
Sales channel selection is a typical consumer<br />
<strong>market</strong>ing subject and as such a very important<br />
one. As discussed in Chapter 7, most exporters<br />
from developing countries make use of<br />
intermediaries when trading with far-away<br />
<strong>market</strong>s. The reasons are clear: the multitude of<br />
<strong>market</strong>s and their complexity, the numerous and<br />
tedious tasks of exporting, the regulations and<br />
risks involved, relatively small-scale production<br />
which makes exporting on your own too<br />
expensive and time-consuming, all such aspects<br />
make exporting very difficult. The intermediary,<br />
who is to become your trade partner, may have a<br />
simple task of just getting the goods to the other<br />
side of the border. However, he also may have a<br />
Questions an exporter should pose:<br />
• What is the typical <strong>market</strong> structure for<br />
your products or sector in each country<br />
(See Chapter 7)<br />
• Which potential sales channels exist for<br />
your products in the target <strong>market</strong><br />
• What are the supply lines - are certain<br />
importers/ wholesaler controlling the<br />
<strong>market</strong><br />
• How many intermediaries are there in the<br />
chain (See Chapter 7)<br />
• Who are the main players in the <strong>market</strong><br />
• What are the prices and margins at each<br />
distribution level Discount structures<br />
• What are the most important requirements<br />
of the identified sales channels (quality,<br />
packaging, etc)<br />
demanding job: finding buyers for you and making sure those prospects will be happy with your<br />
products. In practice, your success will largely depend on him. It is, however, also possible to<br />
bypass intermediaries. This will depend on a number of factors, such as the <strong>market</strong> conditions,<br />
size of the company, export experience etc. There are different types of intermediaries; we will<br />
describe the most important ones.<br />
• The importer is an independent company, specialized in importing a certain range of<br />
goods from abroad. Such an organisation buys directly from the exporter and thus<br />
becomes the rightful owner (‘takes title’) of the goods. In turn, he will try to sell them to<br />
wholesalers.<br />
• The (importing) wholesaler is a company that not only imports but also operates<br />
facilities to forward the goods into the distribution channels by means of promotional<br />
support.<br />
• The (commission) agent is an independent person or company, merely intermediating<br />
(bringing the exporter/seller and the importer/buyer together). His services are paid<br />
(usually by the exporter) in the form of a commission, which is a percentage of the (CIF)<br />
value of the goods imported.<br />
81
• The trading house is an independent company that specialises in trading certain range(s)<br />
of goods. Usually it covers a wide field of goods, sometimes even competing. A trading<br />
house or -company buys and sells for its own account and risk, and decides on its own<br />
export assortment; if your product happens to be renowned and outstanding, they will not<br />
wait for you but will come and look you up on their own initiative. Trading houses<br />
usually have a strong commercial acumen and professionalism.<br />
• The retailers are more and more involved in importing products themselves. This is<br />
mostly from a cost-saving point of view.<br />
E-commerce<br />
The internet has very quickly developed into a highly popular medium for business, not only for<br />
consumers but especially for industrial buyers and suppliers, allowing them ‘virtual´ shopping,<br />
fast communication, payment and low-cost promotion. The internet can also be very useful for<br />
contacting partners in a quick and economic way. The UK Institute of Development Studies<br />
(IDS) summarizes their briefing on E-commerce for development:<br />
“E-commerce holds out enormous promises for manufacturers in poor countries: easier access to the<br />
<strong>market</strong>s of rich countries and higher incomes resulting from these new trading opportunities. Many<br />
studies and policy documents, however, have underestimated the obstacles to reaping these benefits. It<br />
is not just a matter of bridging the 'digital divide' that arises from poor telecom infrastructure and lack<br />
of computer-related skills. Only with improvements in the transport of material goods and in the<br />
institutional arrangements that facilitate trust can e-commerce accelerate economic development.”<br />
This statement implies that exporter should be realistic about the opportunities of E-commerce; it<br />
is not a miraculous remedy for bridging the export difficulties which apply to international trade.<br />
Launching or exploiting a website successfully costs a substantial amount of money, time and<br />
expertise (See also Paragraph 13.5).<br />
10.4 Organisational Structures<br />
According to the International Trade Centre,<br />
one of the weaknesses often cited as a<br />
contributor to the lack of success in<br />
international <strong>market</strong>s of exporters in<br />
developing countries is the small size of their<br />
production. With limited funding, it is difficult<br />
to develop economies of scale. In view of the<br />
complicated and demanding nature of<br />
Questions an exporter should pose:<br />
• What volumes and quality is required by<br />
your clients and can you fulfil these<br />
requirements on your own<br />
• Are you financially and organisationally<br />
strong enough to export on your own or not<br />
exporting, you may conclude your company is simply not strong enough to export on its own. In<br />
that case, you may consider joining other (potential or established) exporters in order to meet the<br />
scale required by the international <strong>market</strong>.<br />
Join venture<br />
A joint venture can be described as a relationship which arises from an agreement between two or<br />
more companies to undertake some common objective for their mutual benefit.<br />
Cooperative<br />
According to the International Trade Centre, a cooperative is owned and financed by the people it<br />
serves, and exists for the benefit of its members. Cooperatives practise democratic decisionmaking,<br />
open membership, the sharing of profits and pooled purchasing to reduce the costs of<br />
goods and services. Products are pooled for sale and members have one vote regardless of the<br />
amount of stock they own, Members share responsibility, risks and profits.<br />
82
Partnership<br />
According to the International Trade Centre, a partnership is formed by two or more people coowning<br />
a business. Partners share resources and experience; however the goal and liabilities must<br />
be clearly defined and understood from the start. While partnerships are more flexible and easier<br />
to form than cooperatives, there are also some disadvantages; the partners are mutually liable and<br />
benefit from fewer tax advantages than a cooperative.<br />
Subcontracting<br />
According to the International Trade Centre, subcontracting provides a vehicle for small<br />
manufacturers to accept parts of orders, the totality of which is beyond their individual production<br />
capacities. The main contract is often entered into by the buyer and a non-producing exporter who<br />
then subcontracts production to several manufacturers. These types of arrangements enable the<br />
small manufacturers to meet <strong>market</strong> demand without having to make major financial investments<br />
upfront.<br />
Contract Manufacturing<br />
Chapter 4 describes that more and more European manufacturers in the table- & kitchenware<br />
sector are shifting their production to the so-called low-wage countries, mainly from a financial<br />
point of few. This development offers opportunities for manufacturers in developing countries.<br />
Increasing shares of manufacturers in developing countries are producing so called OEM<br />
products. These products are designed by Western companies and produced in low-wage<br />
countries. Manufactures can produce either the entire product or parts of the product. Asian<br />
countries like China and Taiwan are very successful in this <strong>market</strong> segment as many European<br />
companies ship their production plants to these countries.<br />
The OEM production described above requires organisational abilities and production skills to<br />
successfully manufacture foreign-designed products in the required volumes. Furthermore, it is<br />
important to obtain a constant level of quality, because EU-importers demand high quality<br />
standards concerning these products.<br />
10.5 Logistics<br />
As can be seen in paragraph 10.3, there are<br />
two types of logistics. We can make a<br />
distinction between the materials management<br />
and physical distribution. Materials<br />
management includes all the activities which<br />
are conducted to ensure that raw materials and<br />
semi-finished products run smoothly through<br />
the production process (see paragraph 11.2).<br />
The physical distribution aims at having the<br />
right goods at the right time in the right<br />
volumes at the right place and with a<br />
minimum of costs.<br />
Questions an exporter should pose:<br />
• What is the average delivery time in your<br />
line of business<br />
• What type of transportation is mostly used by<br />
your competitors<br />
• When are the seasonal sell-out periods<br />
(throughout the whole year or with peaks)<br />
• What type of packing is appropriate for your<br />
range of products in the target <strong>market</strong>s (See<br />
also Chapter 9)<br />
In case of the table- & kitchenware, the cycle from production to distribution and selling takes<br />
about 3 or 4 months, depending on product and country of origin. The consequences of such a<br />
long cycle are possibly: too many products and capital tied up in inventory, the possibility of<br />
price decreases in the meantime and missing of sales because the right products are not quickly<br />
available.<br />
Delivery times are becoming more important, as the table- & kitchenware <strong>market</strong> is increasingly<br />
becoming a fashion-sensitive industry and in some cases very seasonal. A product may be<br />
perfectly crafted and sold at competitive prices; however, if a retailer cannot rely on the shipment<br />
arriving as scheduled, there will be no <strong>market</strong>. This applies mostly to the more fashionable<br />
products in the <strong>market</strong>.<br />
83
Retailers are often confronted with variation in consumer behaviour and with rapidly changing<br />
trends in fashion. As cited in Chapter 3, the table- & kitchenware <strong>market</strong> trends change every<br />
twelve to eighteen months. Retailers therefore demand shorter delivery times from manufacturers.<br />
In general, the retailers in the table- & kitchenware <strong>market</strong>, as in many other <strong>market</strong>s, try to shift<br />
the risks of <strong>market</strong> fluctuations to the manufacturers by ordering only small production runs. We<br />
should however note that these so-called “small” production runs can reach substantial sizes.<br />
When large chain stores or garden centres decide to purchase a product, their order can reach to a<br />
full 40-foot container or more.<br />
Because of the tendency to order smaller<br />
series, order frequency is increasing and<br />
retailers tend to use more than one supplier.<br />
This requires more flexibility, and a wellorganised<br />
logistics organisation from the side<br />
of the manufacturers. Automation is one of the<br />
answers for production firms to fulfil the<br />
When shipping your product, you need a customs<br />
declaration. Furthermore, if you want to obtain an<br />
exemption from import duties, the goods must be<br />
accompanied by an original Certificate of Origin,<br />
issued by the assigned authority in the country of<br />
origin. (See also Chapter 9.2)<br />
requirements of the logistics process. Usage of barcode systems (See Paragraph 9.2) by retail<br />
organisations gives quick sales information and is accompanied by electronic order systems, Just-<br />
In-Time (JIT) methods and direct product profitability (DPP). DPP means direct calculation of all<br />
retailing costs, amongst which alternative costs (costs which are caused by untimely delivery of<br />
articles, costs because of marking-down and sales bargains, etc.).<br />
Any developing country manufacturer entering the export <strong>market</strong> must not only estimate costs<br />
accurately before entering into a contract, but must also ensure that the shipping facilities at his<br />
disposal can guarantee delivery within the contractual time requirements. This tends to pose few<br />
problems for countries with access to ports with well-established shipping channels to the EU.<br />
However, it is a problem for many exporters in Africa, for example, who in addition to needing to<br />
move goods overland to a port, must deal with shipping services. A reliable shipping agent is<br />
essential for these exporters. Packaging poses an associated problem. While there is an increasing<br />
worldwide trend for consignments to be container packed at the factory, this can be done only in<br />
countries equipped to handle container ships in the docks of embarkation.<br />
10.6 Price Structure<br />
According to the International Trade Centre, pricing is the process of determining the amount of<br />
money for which your product will sell, based on the costs of producing and <strong>market</strong>ing your<br />
product, balanced against what the <strong>market</strong> will bear. Costs for raw materials, labour costs and<br />
overhead determine the price of your products. The overhead includes all the costs which cannot<br />
be allocated to a product individually, like for example electricity and heating, maintenance,<br />
insurance, <strong>market</strong>ing costs, etc.<br />
As we described in Chapter 7, most products<br />
deriving from developing countries go through<br />
a number of intermediaries. Each intermediary<br />
in the distribution channel has distinct<br />
responsibilities. There are however costs<br />
associated with them. A good knowledge of<br />
the costs per link in the export chain is very<br />
important to determining your retail price. A<br />
good knowledge of different retail prices in<br />
the <strong>market</strong> is also very important. If your price<br />
is too high, you can not compete with other<br />
manufacturers.<br />
Questions an exporter should pose:<br />
• What are the price developments on the<br />
<strong>market</strong> regarding your product(s)<br />
• Are there standard <strong>market</strong> prices for your<br />
products<br />
• How price sensitive are your clients<br />
• How competitive is my pricing compared<br />
with my main competitors<br />
84
If your price is too low, it mostly will affect your profitability. Furthermore it is possible you will<br />
receive more orders than you are able to fill, according to the International Trade Centre.<br />
In Table 10.1, we describe three different mark ups, low, medium and high. It is impossible to<br />
draw up a schedule of actual margins for each product/<strong>market</strong> combination. Even within the same<br />
type of combination, different importers use different margins. This variation is due to the factors<br />
described in the following section.<br />
Table 10.1 Calculation schedule: Prices & Margins<br />
Low Medium High<br />
FOB Manila 90.00 90.00 90.00<br />
C&F Rotterdam / Amsterdam 100.00 100.00 100.00<br />
• Import duties charges on C&F basis* pm* pm* pm*<br />
• Handling charges, transport, insurance and<br />
6.00 6.00 6.00<br />
bank service<br />
Subtotal: 106.00 106.00 106.00<br />
• Importer/wholesaler's margin (20 / 30 / 21.20 31.80 42.40<br />
40%)<br />
Subtotal: 127.20 137.80 148.40<br />
• Retailer's margin (40 / 50 / 60%) 50.90 68.90 89.00<br />
Net selling price 178.10 206.70 237.40<br />
• Value Added Tax (VAT) 19% of net selling 33.80 39.30 45.10<br />
price**<br />
Gross selling price (consumer price) 211.90 246.00 282.50<br />
ratio consumer price/FOB 2.35 2.73 3,14<br />
ratio consumer price/C&F 2.12 2.46 2.83<br />
* Between 0 and 11% of C&F value (see Chapter 9, Table 9.1 of this <strong>market</strong> <strong>survey</strong> for the import duties<br />
on table- & kitchenware)<br />
** In practice, retailers calculate a 90 – 125 percentage mark-up, including VAT. The VAT rates vary per<br />
country in the EU. For information on the VAT rates see Table 9.2<br />
The effect of low, medium and high margins on the retail price, based on the same CFR for three<br />
different products, is shown in Table 10.1. A multiplier of between 2.12 and 3.14 on the<br />
manufacturer’s or importer’s price should be used to calculate an appropriate final consumer<br />
price. The height of this multiplier is influenced by seven factors:<br />
• Degree of risk (highly innovative, new brand, etc.)<br />
• Volume of business (turnover)<br />
• Functions or <strong>market</strong>ing services rendered (advertising, etc.)<br />
• General economic conditions (booming or depressed business)<br />
• Competition<br />
• Exclusiveness<br />
• Velocity of stock turnover<br />
The multiplier has decreased in the last decade, caused by factors like increasing competition at<br />
all levels in the distribution chain, further retail concentration and sales chain integration.<br />
Elimination of the wholesaler, for instance, can lead to a lower multiplier used by multiples,<br />
department, variety stores and mail-order companies. For more information on pricing and price<br />
structures, we refer to the “Product Costing and Pricing Training Module” issued by the<br />
International Trade Centre. Also check the CBI’s “Export planner”.<br />
85
10.7 Product profiles<br />
The product profiles below summarise the main issues which are of interest to a potential<br />
exporter, like <strong>market</strong> requirements, structure and main suppliers. In addition, the product profiles<br />
provide some ideas on how to improve the quality of the product. Two examples are given, one<br />
concerns plates, another mugs.<br />
PRODUCT PROFILE: PLATES<br />
Market requirements Product characteristics<br />
The quality standards / regulations:<br />
The regulations are discussed in<br />
Chapter 9. This chapter also<br />
discusses the eco-label. Besides<br />
the restrictions, it is also important<br />
to contact your business partner<br />
about the quality of your products<br />
(see § 11.1). The following<br />
regulations apply to plates (Check<br />
also Table 9.2):<br />
• NEN-EN 1900:1998<br />
• ISO 6486-1:1999<br />
• ISO 6486-2:1999<br />
Packaging<br />
• Protect the products from<br />
breaking<br />
• A nice packaging has a sales<br />
promoting effect.<br />
• It should give information<br />
about the product (See<br />
marking & labelling in § 9.1)<br />
For more information please read<br />
Chapter 9 and the packing manual,<br />
which can be obtained from CBI<br />
Marking & Labelling<br />
• Identification (name and<br />
address) of the exporter.<br />
Name of the product and<br />
variety.<br />
• Origin and nature of the<br />
product.<br />
• Mark if content is fragile (See<br />
§ 9.1).<br />
• Information about property of<br />
products (for example,<br />
disherwasher-safe)<br />
Import regulations<br />
For information about import<br />
regulations we refer to § 9.2.<br />
Relevant documents are:<br />
• AWB or Bill op loading<br />
• EUR 1 for ACP countries<br />
• Form A<br />
Chapter 9 of this <strong>survey</strong> gives you<br />
a good indication of requirements<br />
concerning dinnerware<br />
Materials used<br />
In most cases, dinner plates are made<br />
of the following materials:<br />
• Porcelain<br />
• Ceramic<br />
• Glass<br />
• Metal<br />
• Plastic<br />
Size<br />
The diameter and height of a plate<br />
depends on it functionality, the<br />
diameter varies from approximately 8<br />
– 40 centimetres. The height varies<br />
from 1 – 4/5 centimetres<br />
Function<br />
diameter Function<br />
8 -13 cm Coffee-dish, sold mostly<br />
in combination with a<br />
coffee-cup<br />
13-15 cm Cake-dish<br />
20-25 cm Small dinner plate<br />
25-35 cm Medium dinner plate<br />
35-45 cm Large dinner plate<br />
Other variations are for example deep<br />
plates to serve soup.<br />
Price<br />
The retail price varies depending on<br />
the size, quality and brand of de<br />
product. The price can vary from<br />
€ 2.00 to more than € 20.00. In<br />
general we can define three segments<br />
(see also Chapter 8): The lower price<br />
segment from € 2.00 to € 6.00. The<br />
medium segment from € 6.00 to €<br />
12.00. The premium segment ranging<br />
from € 12.00 to more than € 20.00<br />
per plate.<br />
Trends<br />
The <strong>market</strong> is becoming more<br />
fashionable, this having implications<br />
for the lifespan of your product<br />
range. It is therefore important to take<br />
notice of new developments, colours,<br />
etc. (See also § 10.1)<br />
Market characteristics<br />
Main <strong>market</strong>s<br />
The main <strong>market</strong>s in the EU, are France<br />
and Italy you should however note that<br />
both these countries have a notable<br />
table- & kitchenware production<br />
themselves (See also Chapter 3 and 4).<br />
Sales channels<br />
The main sales channels through which<br />
plates are sold are mixed & independent<br />
retailers, department stores and grocery<br />
multiples. The discounter however is<br />
gaining ground.<br />
Market developments<br />
As noted, the table- & kitchenware<br />
<strong>market</strong> is becoming more informal.<br />
Practical and durable products are<br />
popular at the moment. They need to be<br />
microwave- and dishwasher-proof.<br />
Margins<br />
The margins on table- & kitchenware<br />
are generally low (See also Chapter 4).<br />
86
PRODUCT PROFILE: MUGS<br />
Market requirements Product characteristics<br />
Market characteristics<br />
The quality standards / regulations:<br />
The regulations are discussed in<br />
Chapter 9. This chapter also<br />
discusses the eco-label. Besides<br />
the restriction, it is also important<br />
to contact your business partner<br />
about the quality of your products<br />
(see § 11.1). The following<br />
regulations apply to plates (Check<br />
also Table 9.2):<br />
• NEN-EN 1900:1998<br />
• ISO 6486-1:1999<br />
• ISO 6486-2:1999<br />
Packaging<br />
• Protect the products from, for<br />
example, breaking<br />
• A nice packaging has a sales<br />
promoting effect.<br />
• It should give information<br />
about the product (See<br />
marking & labelling in § 9.2)<br />
For more information please read<br />
Chapter 9 and the packing manual,<br />
which can be obtained from CBI<br />
Marking & Labelling<br />
• Identification (name and<br />
address) of the exporter.<br />
Name of the product and<br />
variety.<br />
• Origin and nature of the<br />
product.<br />
• Mark if content is fragile (see<br />
§ 9.1).<br />
• Information about property of<br />
products (for example,<br />
dishwasher safe)<br />
Import regulations<br />
For information about import<br />
regulations we refer to § 9.2.<br />
Relevant documents are:<br />
• AWB or Bill op loading<br />
• EUR 1 for ACP countries<br />
• Form A<br />
Chapter 9 of this <strong>survey</strong> gives you<br />
a good indication of requirements<br />
concerning dinnerware<br />
Materials used<br />
In most cases, dinner plates are made<br />
of the following materials:<br />
• Porcelain<br />
• Ceramic<br />
• Glass<br />
• Plastic<br />
• Metal<br />
Size<br />
The diameter and height of a mug<br />
depends on its functionality and<br />
design, the diameter varies from<br />
approximately 6 – 9 centimetres. The<br />
height varies from 7 – 10 centimetres.<br />
Exceptions are however possible.<br />
Price<br />
The prices vary from € 1.00 to more<br />
than € 20.00. As with plates, there are<br />
roughly three segments. The lower<br />
price segment from € 1.00 to € 4.00.<br />
The medium segment from € 4.00 to<br />
€ 8.00. The premium segment<br />
ranging from € 8.00 to more than €<br />
20.00 per mug.<br />
Trends<br />
The <strong>market</strong> is becoming more<br />
fashionable, this having implications<br />
for the lifespan of your product<br />
range. It is therefore important to take<br />
notice of new developments, colours,<br />
etc. (See also § 10.1)<br />
Main <strong>market</strong>s<br />
The main <strong>market</strong> in the EU, are France,<br />
Germany and Italy. However, note that<br />
all these countries have a notable table-<br />
& kitchenware production themselves<br />
(See also Chapter 3 and 4).<br />
Sales channels<br />
The main sales channels through which<br />
plates are sold, are mixed &<br />
independent retailers, department stores<br />
and grocery multiples. The discounter<br />
however is gaining ground.<br />
Market developments<br />
As noted, the table- & kitchenware<br />
<strong>market</strong> is becoming more informal.<br />
Practical and durable products are<br />
popular at the moment. They need to be<br />
microwave- and dishwasher-proof.<br />
Mugs with funny prints are often sold as<br />
giftware in the EU<br />
Margins<br />
The margins on table- & kitchenware<br />
are generally low (See also Chapter 4).<br />
87
11<br />
INTERNAL ANALYSES<br />
The internal analysis is a review of a company's strength and weaknesses in terms of all company<br />
resources, such as export <strong>market</strong>ing capabilities, finance, personnel, internal organisation,<br />
management, infrastructure, etc. As a result of this internal analysis, you will be able to assess to<br />
what extent your company is able to take advantage of the opportunities identified in the former<br />
chapter. Furthermore, with a thorough understanding of your company's unique capabilities, you<br />
are able to invest in opportunities that exploit your strengths.<br />
11.1 Product standards/ quality, Production capacity, Product design & development<br />
and Unique selling points<br />
Product standards/ quality<br />
As can be seen in Chapter 9, the product<br />
legislation in the EU is very strict. Products<br />
which come into contact with food must meet<br />
stringent quality standards in the EU. In<br />
Chapter 9, the most important EU legislation<br />
regarding consumer safety is discussed.<br />
Besides the official legislation laid down by<br />
the EU, products for the table- & kitchenware<br />
<strong>market</strong> generally, must meet stringent quality<br />
standards. It is however difficult to define<br />
precisely the concept “product quality”. Every<br />
importer, wholesaler, retailer etc. applies its<br />
own standards. It is therefore important to<br />
conclude clear agreements on the quality level<br />
of the products to be supplied.<br />
Product design & development<br />
The design of your product is very important,<br />
as can be seen in paragraph 3.2. Good design<br />
and product innovation help to differentiate<br />
products, to establish consumer loyalty and<br />
trust and, in many cases, allow products to<br />
command a price-premium. Design is the<br />
biggest element of value addition. Design<br />
cannot originate in a vacuum. Poor or<br />
inadequate designs can make or mar the<br />
process of successful export <strong>market</strong>ing. Lack<br />
of sufficient understanding of customer needs,<br />
fashion, trends, and lifestyles can result in<br />
incomplete design appreciation. Designers<br />
need considerable exposure to the target<br />
<strong>market</strong> before the design process can succeed.<br />
The customer-design interface is a matter of<br />
deep understanding of the target <strong>market</strong>.<br />
Consistent product development gives your<br />
company a unique selling point (USP).<br />
Questions an exporter should pose:<br />
• What management quality standards does<br />
your company fulfil (ISO)<br />
• What is the general level of your product<br />
quality compared to other products in the<br />
identified <strong>market</strong><br />
• In case labelling significantly improves the<br />
competitiveness of your export product,<br />
which one is the most interesting for your<br />
product-<strong>market</strong> combinations<br />
Questions an exporter should pose:<br />
• What quantities do you produce<br />
• How is the present capacity being used<br />
• What quality level can you maintain for a<br />
longer period of time<br />
• How many different products can you<br />
produce in a given time<br />
• What is the influence of the new export<br />
activity on your domestic sales<br />
• What will be the cost of setting up additional<br />
production capacity and is that possible at<br />
all<br />
• What cycles of production apply to your<br />
products Is there a seasonal emphasis and<br />
how does this match up to the demand in the<br />
target <strong>market</strong><br />
88
Production capacity<br />
Although some foreign buyers are looking for a 'spot' purchase, most importers are searching for<br />
suppliers who produce a quality product at a fair price with continued availability. If you are<br />
merely looking to <strong>market</strong> your sporadic surplus capacity, then entry into the European <strong>market</strong><br />
will probably be a disappointment. On the other hand, if your company is willing to devote even<br />
10 percent of its production capacity to foreign <strong>market</strong>s and the servicing of these accounts, then<br />
an exporter can reasonably expect to build substantial, permanent trade in those <strong>market</strong>s suited to<br />
its products. However, keep in mind that, often, the volume of the product <strong>market</strong>ed is not as<br />
important as the consistent and reliable supply of the product.<br />
Unique selling points<br />
A means to assess your company's potential in<br />
exporting is by examining the unique or<br />
important features of your company and<br />
products. If those features are hard to<br />
duplicate abroad, then it is more likely that<br />
you will be successful overseas. A unique<br />
selling proposition (USP) defines what makes<br />
your business unique from every other<br />
competitor in the field. It spells out the precise<br />
niche you seek to fill, and how you aim to fill<br />
it.<br />
Questions an exporter should pose:<br />
• What is the speciality of your company In<br />
terms of for example skills, production,<br />
design, price, delivery.<br />
• In what respect is your company outstanding<br />
or unique in this speciality<br />
• How can you explain your unique selling<br />
point (USP) to a buyer<br />
The competitive analysis in Paragraph 10.2 will help you identifying your strong points in<br />
comparison with the strengths and weaknesses of your competitors<br />
11.2 Logistics<br />
As stated in paragraph 10.4, material management includes all the activities which are conducted<br />
to ensure that raw materials and semi-finished goods run smoothly through the production<br />
process. This also includes planning your production process in an efficient manner. Controlling<br />
your supply of raw materials and personnel can improve your flexibility, prevent delay and<br />
failures and cut production times. However, the most important thing is that it can reduce your<br />
costs.<br />
The production process starts with obtaining<br />
raw materials, this includes finding suppliers<br />
of raw materials, closing deals (contracts),<br />
determining the quantity and, maybe,<br />
spreading your purchases amongst different<br />
suppliers. The latter is very important, as it<br />
will spread your risk and prevent you from<br />
becoming too dependent on just one supplier.<br />
Hiring personnel is also an important aspect of<br />
the production process. Make sure that the<br />
amount of personnel matches the work which<br />
is available. When talking about personnel, we<br />
often speak of “Human resources”, which<br />
includes, for example, drafting contracts,<br />
training, motivating, hiring and salary<br />
systems.<br />
Questions an exporter should pose:<br />
• Do you have reliable suppliers, which offer a<br />
constant level of quality<br />
• Are you able to meet required delivery terms<br />
in time/ quality<br />
• Do you have more than one raw material<br />
supplier This with the aim to minimise your<br />
supply risks.<br />
• Do you have skilled workers – are they easy<br />
obtainable<br />
• How is your organisational ability to cope<br />
with peak periods<br />
The internal logistical and production process is very important for the competitive position of<br />
your company. Reviewing your production processes regularly can help you to improve the<br />
product quality, shorten production times and save costs. When doing so, it is very useful to learn<br />
about “new” production techniques.<br />
89
11.3 Marketing & Sales<br />
One of the most difficult aspects of exporting, even for established exporting companies, is that<br />
of ensuring optimal exposure to, and communication with, decision-making personnel in a client<br />
company, often thousands of miles away. For an exporter, it is very important to know the “ins<br />
and outs” of the export <strong>market</strong>. The best method of achieving this objective is, unquestionably, to<br />
have an able company representative in the country or geographical area concerned. Such an<br />
individual must be proficient in the language of the target <strong>market</strong>. Ideally, he or she will have a<br />
profound technical knowledge of, and practical experience with the various table- &<br />
kitchenwares. He/she must also be conversant with the technical implications of provisions in<br />
trade contracts, and should also be able to negotiate confirmed contracts swiftly on behalf of the<br />
exporter and should have access to rapid communication facilities (See also Paragraph 10.3 sales<br />
channel assessment). A big disadvantage of a company representative in the country concerned is<br />
the high costs involved.<br />
Other methods of keeping in contact with your business relations and their <strong>market</strong> are E-mail<br />
and/or telephone. These are also excellent communication and sales tools which only cost a<br />
fraction of a sales representative. We should however point out that an occasional visit to your<br />
business relations and their country can help you to get to know the <strong>market</strong> and the preferences of<br />
consumers there. Visiting and attending trade fairs in the export <strong>market</strong> can also provide you with<br />
interesting <strong>market</strong> knowledge (See also Paragraph 13.4).<br />
Marketing<br />
Marketing is about adapting the product, price,<br />
promotion and distribution to the <strong>market</strong><br />
requirements. This makes the <strong>market</strong>ing<br />
department a vital part of the organisation.<br />
The effects of <strong>market</strong>ing on your management<br />
are two-fold. First, it should inspire all<br />
corporate activities to be concentrated on the<br />
main goal: to satisfy the needs and wants of<br />
your customers. Your customer deserves all<br />
your attention since he (or she) is the source of<br />
your income. In this sense, <strong>market</strong>ing<br />
An important decision an exporter should make,<br />
is whether to export on its own or rethink other<br />
possibilities like for example contract<br />
manufacturing (See Paragraph 10.4 and Chapter<br />
4) Marketing efforts in the case of contract<br />
manufacturing will be focussed on fewer parties,<br />
than general export <strong>market</strong>ing. On the other hand,<br />
contract manufacturing possibly requires extra<br />
investments in order to fulfil the volume and<br />
quality standards of the customer.<br />
describes an attitude of all people involved. Secondly, the <strong>market</strong>ing concept also includes the<br />
techniques and methods required to ‘bring the right product to the right consumer at the right time<br />
and place’. In general, <strong>market</strong>ing will keep your organisation in touch with <strong>market</strong> requirements<br />
and changing <strong>market</strong> trends. This, of course, is crucial to your success as an exporter (See also<br />
Chapter 3).<br />
In most cases, manufacturers in the table- & kitchenware <strong>market</strong> make use of two types of<br />
<strong>market</strong>ing: consumer <strong>market</strong>ing to your end-consumers often called business-to-consumer<br />
<strong>market</strong>ing (mainly persons, seldom organisations), and industrial <strong>market</strong>ing to your intermediate<br />
buyers and trade partners, often called business-to-business <strong>market</strong>ing. For further information<br />
about this topic, we refer to the CBI’s “Export Planner”.<br />
Sales<br />
An efficient telephone sales department is also an important prerequisite for successful <strong>market</strong><br />
participation. The essential tool used in the telephone sales department is a detailed up-to-date<br />
customer database. The customer database contains the following information:<br />
• Basic data on the customer (long-term data, such as name, address, telephone number,<br />
etc.).<br />
• Changing data on customers (data resulting from business with the customer, such as<br />
telephone calls, offers, sales statistics, etc.).<br />
90
11.4 Financing<br />
Obtaining financial resources is one of the most difficult tasks for exporters in developing<br />
countries. In general, exporting consumes a lot of financial resources. A company should<br />
therefore assess its financial position. This largely determines your exporting prospects. It is no<br />
good developing five new <strong>market</strong>s if the company only has the money to develop one.<br />
The following aspects should be considered when the financial capabilities of an exporting<br />
company are being analysed: capital investment, the stage of the production process and<br />
complementary activities, and the financial settlement of the contract. Some parts of the table- &<br />
kitchenware <strong>market</strong> are capital intensive and regular investment in new equipment is required to<br />
ensure competitiveness. This is particularly the case in those parts of the industry which are<br />
highly automated and produce long runs of relatively undifferentiated products.<br />
The most likely source of export financing is earlier retained earnings. Other sources of finances<br />
are private funds and your commercial overdraft facility (line of credit) with your bank.<br />
According to the ITC, the most common method of financing in developed countries is an<br />
operating line of credit. This resource, however, is not always available to exporters in<br />
developing countries. Because of the lack of these financial resources, many manufacturers in<br />
developing countries ask for an advance. An exporter could for example ask the buyer to pay 1/3<br />
of the total order at the time when the order is placed, 1/3 at the time of shipment (when the<br />
goods have been produced) and 1/3 at the time of delivery to the importer/ retailer, etc. This<br />
provides you with enough financial resources to make the expenditure and investments required<br />
throughout the production process.<br />
If your country has an export development bank or International Financial Institutions (IFI’s), you<br />
can explore what terms they can offer you, for example loan terms, subsidy, etc. According to the<br />
International Trade Centre, these multilateral development banks, or International Financial<br />
Institutions (IFI’s), award contracts worth approximately $30 billion each year. Note that the<br />
IFI’s can have certain regulations, with which you have to comply in order the get support.<br />
Also, check paragraph 13.4, concerning the different types of payment conditions. Further<br />
information concerning this topic is to be found on the website of the International trade Centre<br />
publication, www.intracen.org.<br />
11.5 Capabilities<br />
You should consider the fact that exporting will put an extra strain on all your people and your<br />
other corporate resources. In fact, you are effectively considering starting-up an additional<br />
commercial operation, parallel to your domestic one. The main question should be whether you<br />
think the organisation is strong enough to cope with the extra challenge and workload of the<br />
exporting venture. This is an extremely important decision, since the very existence of the<br />
company may be at stake. The competition in Western <strong>market</strong>s is severe. Many entrepren<strong>eu</strong>rs<br />
before you have tried to penetrate these <strong>market</strong>s and failed. It is therefore important to<br />
acknowledge the issues below.<br />
Commitment to export<br />
It is important to consider whether the company employs people who are able to sell and develop<br />
an international business. The company should be able to generate the physical and administrative<br />
infrastructure to deal with increased activities due to exporting - not only in dealing with orders<br />
but also with processing customs and shipping documentation. If this type of infrastructure is<br />
limited, it will be a weak spot in developing sustained export activities.<br />
Your export <strong>market</strong>ing efforts will need a sizeable budget in order to succeed. Contacting and<br />
maintaining clients, printing brochures, attending fairs, etc could cost a substantial amount of<br />
your financial resources.<br />
91
Export experience<br />
There is a consensus that <strong>market</strong>-specific know-how can create a form of distinctive competence<br />
in key <strong>market</strong>s, on for example cultural issues, organisational routines, structure and controls.<br />
Furthermore, institutional knowledge concerning regulations, finance and economics are very<br />
beneficial when conducting trade.<br />
Language skills<br />
It is essential for an exporter that contacts are handled in a professional manner in order for the<br />
cooperation to flourish. Communication is vital when dealing with clients. In the EU, most people<br />
speak English. When language differences arise, an exporter should take precautionary measures,<br />
like hiring an interpreter, to ensure smooth handling of communication.<br />
Trading practises<br />
Be honest and direct concerning quality, capacity, and delivery times. For example, in case of<br />
delays, inform the importer in good time and state the reason for the delay. This will increase<br />
your credibility as an exporter.<br />
Design & research capabilities<br />
The needs and wants of <strong>market</strong>s abroad will almost certainly differ from those of your home<br />
customers. That means that you may have to change your (product) design to adapt it to the<br />
foreign customers’ wishes. In <strong>market</strong>ing terms you will have to match your product with the<br />
<strong>market</strong>’s needs and wants. Good research and design capabilities are indispensable if you want to<br />
successfully export to the European Union.<br />
Innovation is another important capability. Products in the table- & kitchenware <strong>market</strong> have a<br />
limited life-time. They become old-fashioned or outdated rather quickly. The underlying reason is<br />
that the consumers’ preferences are constantly evolving and changing, even to the point of<br />
unpredictability.<br />
92
12 DECISION MAKING<br />
12.1 SWOT and situation analysis<br />
After assessing the external <strong>market</strong> environment in the Chapters 1 to 10, you will be able to<br />
identify specific <strong>market</strong> opportunities and threats, related to your line of business. Chapter 11<br />
describes the position of the producing company in relation to the <strong>market</strong>. This internal analysis<br />
identifies strengths and weakness of the exporter’s company. Combining, the external and<br />
internal analyses results in the so-called SWOT analysis (strengths, weaknesses, opportunities,<br />
threats). In the SWOT, the most important strong and weak points and the important opportunities<br />
and threats are ranked in order of importance. The purpose of this analysis is, to clearly show the<br />
position of the company in the <strong>market</strong>. The essence of the SWOT analysis is to find a <strong>market</strong><br />
segment where there is an opportunity that<br />
matches the strengths and where the threats have a<br />
minimum impact on the vulnerable side, the<br />
Strengths<br />
Weaknesses<br />
weaknesses of the company. In fact, by matching<br />
external opportunities and internal capabilities, the<br />
exporter should be able to identify suitable target<br />
countries, <strong>market</strong> segments and target product(s)<br />
within these countries.<br />
Opportunities<br />
Threats<br />
12.2 Strategic options & objectives<br />
After assessing suitable target <strong>market</strong>s, the company is now able to conclude on whether or not to<br />
export. When you have decided to go ahead with your export preparations, your first step is to<br />
prepare the <strong>market</strong>ing mix, the instruments for export <strong>market</strong>ing. You have finished the analytical<br />
work; now you should start with the constructive part - also called synthesis - of the job. It<br />
requires a different mindset, which will complicate things. Designing the <strong>market</strong>ing mix implies<br />
that all the tools and methods you need for exporting will be made fit for that purpose. Important<br />
items in this process of preparation are decisions on ‘what, when, where, why and how’:<br />
• what product<br />
• offered at what price to the target <strong>market</strong>,<br />
• through which sales channel (where),<br />
• at which period of the year to approach the sales channel (when);<br />
• how the customer is informed about your product<br />
• why the customer will respond to your offer and, finally,<br />
• how to handle aspects of manufacturing and quality in reaction to the consumers’<br />
response.<br />
The next phase of the export <strong>market</strong>ing process is to draw up an Export Marketing Plan (EMP),<br />
which defines a <strong>market</strong>ing strategy and an operational plan, stating how the company is going to<br />
penetrate the identified <strong>market</strong>. The <strong>market</strong>ing strategy is designed on the basis of the information<br />
collected in the internal and external analysis. The <strong>market</strong>ing tools will be described in the<br />
following chapter (Chapter 13). Formulating an export <strong>market</strong>ing strategy, based upon sound<br />
information and its proper assessment, increases the chances that the best options will be selected,<br />
that resources will be utilized effectively, and that efforts will consequently be carried through to<br />
completion. For assistance in writing an EMP, please refer to the CBI's "Export Planner".<br />
93
13 MARKETING TOOLS<br />
Now that you have decided to go ahead with your export preparations, your first step is to prepare<br />
the <strong>market</strong>ing tools (product, price and promotion, place), the instruments for export <strong>market</strong>ing.<br />
Which <strong>market</strong>ing tools can you use to successfully build your export business This chapter will<br />
provide you insight and give tips how to make use of your <strong>market</strong>ing tools to promote the sales of<br />
your products and to build a favourable trade relationship. This chapter deals with the following<br />
subjects:<br />
• Matching products and the product range (specifying range, width and depth,<br />
specifying the product characteristics, packaging design and seasonal influences)<br />
• Building up a relationship with a suitable trading partner<br />
• Drawing up a general or a specific offer<br />
• Handling the contract, divided into contract terms and contract fulfilment<br />
• Sales promotion advertising and communication, sales organisation and participation<br />
in trade fairs.<br />
13.1 Matching products and the product range<br />
Most table- & kitchenware is sold in sets (crockery sets, cutlery sets, etc.) it is therefore important<br />
that the manufacturers of these products offer a consistent range of different products (product<br />
range depth). This range can include matching mugs, plates, bowls, teapots, etc. Some<br />
manufacturers even offer crockery sets consisting of more than 50 items. Figure 13.1 gives<br />
examples of different ranges. Most table- & kitchenware manufacturers offer different product<br />
ranges (product range width). These product ranges vary in price, design and width (number of<br />
products included). Most sets sold are sets for either 4, 6 or 8 persons. Most EU manufacturers<br />
offer different product ranges, each range designed for a specific <strong>market</strong> segment. The price and<br />
quality are also adapted to these different segments<br />
Figure 13.1 Different set of table- & kitchenware<br />
Crockery set Cooking set Cutlery set<br />
Product design<br />
Chapter 3.3 described that the table- & kitchenware <strong>market</strong> is shifting from traditional to more<br />
fashionable. This development means that, according to sources at the Birmingham Autumn Fair,<br />
trends in the table- & kitchenware <strong>market</strong> change totally every twelve to eighteen months.<br />
Product design has become of increasing importance. In Chapter 3.2, developments concering the<br />
different product groups were discussed.<br />
94
Presentation of product characteristics<br />
An importer can only select you as a suitable business partner if he/she knows exactly what range<br />
you can offer. A precise review of the product range, therefore, aims at identifying the most<br />
suitable candidate(s) out of the many potential customers. A product range consists of several<br />
product groups (range width), each with several different products (range depth). One product can<br />
have several variations, as described earlier in this paragraph.<br />
It is therefore wise to compose a list all the products you produce, together with their varieties.<br />
Furthermore, state their colour, size, the period in which you are able to supply them and the<br />
packaging method. This enables potential customers to make an appraisal of your complete<br />
product range. It is very important to keep the list up-to-date. The presentation of your products<br />
and its range should be flexible, so that adjustments and changes can be made, if the need arises.<br />
Packing your product<br />
Besides a protective function, packaging is also very important for the <strong>market</strong>ing of the product.<br />
An attractive package design can have a sales promoting effect. Today’s consumers want to know<br />
what they are buying. Therefore, it is important, as a minimum, to state the product brand name,<br />
special materials used in the production, the name or logo of the manufacturer and country of<br />
origin. The label on the article has to provide these data in a language comprehensible in the<br />
target <strong>market</strong>. For more information, check also paragraph 9.4.<br />
13.2 Building up a relationship with a suitable trading partner<br />
Among the many potential customers, you must identify those who match your own company<br />
profile and product range and are therefore most suitable for building up a relationship. Check<br />
your potential trade partners’ financial status, credibility, and reliability. A good source for<br />
information about your (potential) trading partners is Dunn & Bradstreet (www.dnb.com). This<br />
company specialises in sourcing reliable, consistent and objective credit information about<br />
potential trading partners.<br />
At the end of the identification phase, the supplier should have selected the names and addresses<br />
of suitable trading partners. Check the following sources of information to find information on<br />
your trade partners. Note that many sources of information only answer written inquiries!<br />
Generally, a concise but detailed inquiry improves the chances of precise identification.<br />
• The foreign–trade Chamber of Commerce of the country of destination.<br />
• The Economic Affairs department of the official representative (Embassy or Consulate)<br />
of the country of destination.<br />
• Import promotion organisations<br />
• Trade associations<br />
• Own company’s public and private trade promotion bodies<br />
• Own country’s diplomatic and consular representatives<br />
• Chambers of commerce<br />
• Trade fair organisers (see Appendix 4.3)<br />
Evaluate the received names and addresses, using the following criteria:<br />
• Is the importer active in the country you have selected<br />
• Does the importer focus his activities on corresponding (i.e. your) product groups<br />
• In which <strong>market</strong> segment is the importer active<br />
• Names of other suppliers to the importer<br />
• Were you supplied with enough and sound information about the reliability of this<br />
partner<br />
95
13.3 Drawing up an offer<br />
There are two different kinds of offers: general and specific. The purpose of a general offer is to<br />
make the first contact with potential trading partners with whom the supplier is not yet personally<br />
acquainted. A general offer consists of sending a short profile of your own company and a<br />
summary of your product range. Furthermore, it might help to send a reference list of existing<br />
customers. Write a personal letter, briefly introduce your company and tell what you have to<br />
offer. A specific offer is legally binding for a certain period. You must therefore be capable of<br />
fulfilling the terms of contract. You should make up a specific offer only when you know the<br />
business partner personally or after you have made the initial contact. A specific offer should<br />
consist of two parts: a written offer and/ or product sample. The written offer should include:<br />
• Name of the person responsible in your company.<br />
• Exact description of the goods offered (preferably using an internationally valid quality<br />
standard specification).<br />
• Price of the goods offered in accordance with the Incoterms (ICC publication; if<br />
applicable, split up by delivery quantities or quality).<br />
• Possible delivery date and terms of delivery and the validity date of the offer<br />
A written offer can be accompanied by product samples. The sample, if it is of good quality, will<br />
inspire confidence in prospective buyers. Product samples must correspond to the goods available<br />
for delivery; if they do not, this can have a lasting negative effect on the business relation. Define<br />
the quality of the product if possible, provide quality certificates from an internationally<br />
recognised inspection organisation and send a reference list of existing customers.<br />
When making an offer, the price of the products is very important. The height of the offered price<br />
is one of the determining factors for whether the importer wants to order your products (check<br />
Chapter 10.4). Recommendable action for both general and specific offers:<br />
• A telephone call to ask whether the offer and the samples, if applicable has/ have arrived.<br />
• An invitation to visit your company.<br />
• Possibly, propose a visit to the country of destination. In that case, if necessary, hire an<br />
interpreter, ask your own consulate or other intermediaries for assistance.<br />
Communication by e-mail is an excellent tool, especially when a rapid reaction is needed, e.g.<br />
within 24 hours. This is a very positive, sustaining element towards buyers, making a reliable<br />
impression and instilling confidence. The most exacting aspect of exporting, even for the<br />
established exporting company, is that of ensuring optimal exposure to, and communication with,<br />
decision-making personnel in a client company. The best method of achieving this objective is to<br />
have an able company representative in the country concerned. Such an individual must be<br />
proficient in the language of the target <strong>market</strong>. Ideally, he or she will have thorough technical<br />
knowledge of the implications of provisions in trade contracts and should have access to rapid<br />
communication facilities. A personal sales visit should be attempted, accompanied by an adequate<br />
sample of the product on offer.<br />
96
13.4 Handling the contract<br />
Differing customs, habits and traditions can cause problems in business relationships, even after<br />
both partners have carried out sound preliminary investigations. To prevent problems, many<br />
companies make use of a contract. This written settlement of an agreement is common practice in<br />
most Western countries. Many partners would be satisfied with a simple letter of agreement,<br />
some even with verbal arrangements (which are legally binding for the parties). But the safest<br />
way is to write a contract. It will avoid misunderstandings which could trouble the co-operation.<br />
In writing a contract, pay particular attention to the official protection that his country’s laws<br />
provide for the trade partner. Although the European Union tries to harmonise regulations on this<br />
aspect, some differences still exist. Most national Chambers of Commerce and Industry have a<br />
standard format for an agency- or importer’s contract, as will the International Chamber of<br />
Commerce (ICC) in Paris, France. Ask your (prospective) trade partner to provide you with a<br />
copy. Always have the final draft of the contract checked by your legal advisers. As it binds the<br />
company, the managing director should approve it. He may ask you - as a company representative<br />
- to sign it.<br />
The terms of the transaction describe to which extent the buyer and the seller have divided the<br />
costs and the risks of the transaction between them. The seller’s task is to make the goods<br />
available; to that task the ‘terms of delivery’ pertain. The buyer should pay, which will be<br />
specified in the “terms of payment”. The terms of delivery describe in detail at what moment the<br />
legal possession (‘title’) of the goods changes hands and at what moment the risk burden shifts to<br />
the buyer. These terms are universally accepted and indicated as “Incoterms” (See CBI’s “Export<br />
Planner”). The Incoterms are also available at the International Chamber of Commerce website<br />
at www.iccwbo.org. The terms of payment describe how and when the money is transferred to the<br />
seller. When contracts are used, the following terms should be considered:<br />
Contract terms:<br />
• Conclude the delivery conditions according to Incoterms.<br />
• When delivering for the first time, it is common to deliver the goods free of commission and<br />
freight-paid.<br />
Contract fulfilment:<br />
• Procure the delivery documents in good time.<br />
• If there is a supply agreement, comply strictly with all parts.<br />
• If you cannot comply with any part of the agreement (e.g. delivery delays or quality<br />
problems), inform the customer clearly and in good time.<br />
• Co-operate on a partnership basis and seek a common solution if conflicts arise.<br />
• Fulfilling the contract should have a high priority, particularly when delivering for the first<br />
time.<br />
Trade relations between exporter and importer are based on trust and can only be built up by<br />
meeting the high expectations of the importer. If an importer finds that the product does not meet<br />
his expectations, this will immediately backfire on the business relationship with the exporter.<br />
Terms of payment<br />
The determination of payment conditions for a regular export transaction is part of the package of<br />
negotiations between seller and buyer. However, they have more or less opposing interests. The<br />
seller wants to have the largest possible guarantee of financial coverage for the goods he has to<br />
supply according to his sales contract. The buyer wants to be sure about availability, quantity and<br />
quality of the goods he buys, before he pays the agreed price.<br />
97
Payment methods vary according to the extent to which the business relationship is developed<br />
and to the availability and popularity of the product offered. The most popular payment method<br />
for beginner traders is to make use of an irrevocable Letter of Credit (L/C) and then, later on, to<br />
trade on the basis of “documents against the payment” (D/P). The L/C is an often-used method of<br />
payment. On the whole, payment takes place on 30 days after the products have been delivered. If<br />
a product is not so popular, or in a starting business relation, payments may take from 60 to 90<br />
days. For popular products, product against payment (P/P) is used more often. Companies having<br />
subsidiaries in third countries generally use clean payments. However, clean payments are often a<br />
starting point for friction, if the importer is not totally trustworthy.<br />
General methods and terms of payment are:<br />
• Clean payment; this method is used when both parties know each other well. The process<br />
is fast and reliable, depending on the credit worthiness of the importer. The bank carries<br />
out the transactions through the Swift electronic data system and the transfer costs are not<br />
very high.<br />
• Documents against payment (D/P): Also known as cash against documents (CAD). The<br />
buyer takes possession of the goods only after payment. Although this method is not very<br />
popular, it is very safe and the costs amount to about 0.1%. One can also make use of a<br />
“documents against acceptance of a bill of exchange.” The Bill of Exchange is not<br />
commonly used in the European Union and it does not guarantee that the bill will be paid;<br />
it is less secure than the D/P.<br />
• The letter of Credit (L/C); is very often used in the beginning of a business relationship<br />
when the importer and exporter do not know each other very well. The LC is irrevocable<br />
and will always be paid. The costs are higher when compared to the D/P method, namely<br />
0.5%. This method is widely used in the European Union when dealing with exporters<br />
from outside Europe.<br />
• Bank guarantee; The buyer’s bank will present a bank guarantee for the amount of the<br />
invoice<br />
• Cheques; Bank guaranteed cheques are generally no problem, though cashing may take<br />
some time, up to six weeks. Not all personal cheques are accepted.<br />
The most commonly used trade terms are:<br />
• CIF (Cost, Insurance, and Freight): Under this condition, for shipments to a designated<br />
overseas port of import, the seller quotes a price for the goods, including insurance costs<br />
and all transportation charges, to the point of disembarkation from the vessel or aircraft.<br />
The seller pays for the cost of unloading cargo at the port of destination, to the extent that<br />
they are included in the freight charges. If the charges are separate then the buyer is<br />
responsible for them.<br />
• FOB (Free on Board): Under this term, the seller quotes a price for goods that includes<br />
the cost of loading at the port of departure. The buyer arranges for transportation and<br />
insurance.<br />
• CFR (Cost and Freight): For shipments to a designated overseas port of import, the seller<br />
quotes a price for the goods that includes the cost of transportation to the named point of<br />
debarkation. The buyer is responsible for the cost of insurance. This is referred to as<br />
“C&F” in the old Incoterms. The seller pays for the cost of unloading the cargo at the<br />
port of destination, to the extent that they are included in the freight charges. If the<br />
charges are separate then they fall to the account of the buyer.<br />
It is recommended that quotations to new European customers should be made on a CIF basis.<br />
However, supplier and importer are free to negotiate any other condition. For further information<br />
concerning this topic we refer to the CBI’s export planner.<br />
98
13.5 Sales promotion<br />
One of the major critical success factors for<br />
exporters of table- & kitchenware to the<br />
European Union is sales promotion. The<br />
objective of sales promotion is to increase<br />
sales. Methods of sales promotion include<br />
giving free samples, discounts, coupons,<br />
special ad items, etc. Sales promotion<br />
measures develop and expand customer<br />
relations, which obligate the selling company<br />
to take good care of existing customers (continuity). This includes, for example, expressions of<br />
thanks to business partners and regular updates on the product range. Supplying brochures of the<br />
product range may be useful for promoting sales, just like keeping business partners up-to-date on<br />
recent product developments. The consequences for production capacity can be that, in some<br />
cases, the production capacity has to be increased in order to service both existing and new<br />
customers.<br />
Advertising and communication<br />
Advertising refers to communication channels<br />
with the aim of increasing the sales of your<br />
products. The prerequisites for successful<br />
communication measures are a clearly defined<br />
target group (“Who buys my product”) and a<br />
well-formulated message (”What do I want to<br />
tell my customer”). Keep in mind that some<br />
communication tools are more suited to<br />
reaching a certain target group than others. For<br />
example, when you want to reach seniors the<br />
internet is probably not the most suitable<br />
communication channel. Timing is also very<br />
important when you want to successfully<br />
advertise your products. In the EU, most<br />
retailers decide twice a year on what products<br />
to sell in the coming season. January/<br />
When contacting your contact in Europe keep in<br />
mind the following:<br />
• Working hours in Europe are usually<br />
between 8:30 –17:30 from Monday till<br />
Friday.<br />
• The difference in time, between your country<br />
and the country of your contact.<br />
It is advisable to commence with communication<br />
measures, which require only a small amount of<br />
planning and co-ordination, such as revising the<br />
company’s standard printed matter.<br />
• Standardise all printed-paper used outside the<br />
company (letterheads, business cards, fax<br />
form, etc.).<br />
• Prepare long-term sales documentation<br />
(company brochure, product range review,<br />
etc.).<br />
• Prepare product-specific sales leaflets.<br />
Make sure your promotion material is up-to-date<br />
February and July/August are the two most important sourcing periods in the year. For example,<br />
in August most retailers are on the look out for Christmas products. Introductions of new<br />
collections as well as advertising should be adapted to these cycles!<br />
When looking at the different advertising and communication possibilities it is important to take<br />
certain factors into account, like the price and the amount of planning the medium requires. These<br />
are important aspects when determining the most suited medium for your product. In Table 13.1,<br />
we have given a number of parameters which can be used to measure the costs of any<br />
communication action. It should be noted that degrees given in Table 13.1 are only approximate.<br />
99
Table 13.1 Parameter to measure the costs of a communication action<br />
Criteria 4 Target group Amount of<br />
planning<br />
Cost per<br />
contact<br />
Total costs Dispersion<br />
losses<br />
Measures 6<br />
and cooperation<br />
Standard printed Existing & + +/++ +/++ +/++<br />
Matter<br />
Potential customers<br />
Phone & mail Existing & ++ ++ ++ +<br />
Campaigns Potential customers<br />
Advertising Existing & ++ ++ ++ ++<br />
in trade journals Potential customers<br />
(Partially unknown)<br />
Internet & E- Existing & +++ + ++ +<br />
commerce<br />
Potential customers<br />
CD-rom Existing & ++ + + +<br />
Catalogues Potential customers<br />
Radio & TV Consumers +++ + +++ +++<br />
Advertising<br />
Promotion to the Consumers +++ +++ +++ ++<br />
Retail trade<br />
+ = low ++ = average +++ = high<br />
Internet & E-commerce<br />
As stated earlier, the Internet is a popular medium for business, not only for consumers but also,<br />
and especially, for industrial buyers and suppliers. For exporters, this medium offers a lot of<br />
business opportunities. The British Department for International Development (DFID)<br />
distinguishes the following applications:<br />
• Online catalogues/ webshop: Despite the fact that sales of table- & kitchenware via online<br />
catalogues to individual consumers are generally low, web-based catalogues can be a<br />
helpful enhancement when dealing with wholesale and retail buyers (business-to-business<br />
or B2B).<br />
• Telling stories: A website can be used to tell the story of your company. Furthermore, a<br />
historical and cultural background of products and fabrication processes can be given.<br />
• Email is by far the most important application for a manufacturer in developing countries.<br />
• Market information; the Internet is an ideal medium for finding information about<br />
European <strong>market</strong>s. E.g. it allows manufacturers to see what table- & kitchenwares are<br />
currently on sale in stores in the EU-countries.<br />
You should however be realistic about using the Internet as a sales medium. At this moment, only<br />
a few companies employ the Internet successfully. According to the <strong>survey</strong> of the British<br />
Department for International Development (DFID), internet sales of table- & kitchenware, like<br />
many other products, are quite small. Furthermore, developing and maintaining an interesting, upto-date<br />
website can cost a substantial amount of money, time and expertise.<br />
If you decide to develop a website, is it very important to register the website at different search<br />
engines. Search engines, such as Google, Yahoo, Alta Vista etc., are still the commonest way<br />
people use to find websites and information sources on-line. If you sell e.g. table- &<br />
kitchenwares, you will have to submit so called ‘key words’ like “tableware” to the search<br />
engines. Secondly you should create clickable ‘links’ on your website with other companies’<br />
websites, which, in return, place links on their website to yours. This approach enhances the socalled<br />
ranking of your website in the different search engines’ results.<br />
100
A ‘ranking strategy’ is very important, but increasingly hard to achieve, since every company<br />
wants to realize high listings. Creating an attractive ranking for your website has therefore more<br />
and more become a specialist’s job.<br />
Participation in trade fairs<br />
Once the final decision is made that your<br />
company will focus on exporting for the years<br />
to come, remember: “Exporting is a long-term<br />
business” and the decision to start exporting<br />
Think of the language problem and the physical<br />
presentation of the front liners!<br />
must be a very well considered. Participation in national and international trade fairs may be a<br />
useful sales promotion tool in the table- & kitchenware sector. However, besides a heavy<br />
financial involvement (participation fees, travelling, accommodation, sampling etc.), trade fair<br />
participation requires advance knowledge and a detailed <strong>survey</strong> because of its complex nature:<br />
• Selection of a suitable trade fair (See Appendix 4.3)<br />
• Preparations for participation, design and lay-out of the stand, which includes lighting,<br />
furniture, wall and floor coverings, decorations, drinks (coffee, tea etc.) etc. Skilled staff<br />
(office and frontliners) is necessary.<br />
• Follow-up activities.<br />
Pre-fair activities:<br />
• Update your collections (try to be up-to-date)<br />
• Update your customer files.<br />
• Prepare all documentation (business cards, company brochures, leaflets).<br />
• Make use, if possible, of a business-related consultant.<br />
• Make a preparatory mailing, informing your present and potential clients of your exact<br />
booth location at the fair and invite them to visit you and/or propose to visit them (i.e. the<br />
existing clients).<br />
.<br />
Running fair activities:<br />
• Register all contacts<br />
• List them under different priority levels, i.e.: “High”, “Medium” and “Low”.<br />
• Be a perfect host! Bear in mind that most visitors have travelled a long way and come<br />
with great expectations!<br />
Post-fair activities:<br />
• Enter all your contacts in a database or file them.<br />
• Fulfil your promises in time, concerning sending samples, leaflets, brochures, price lists,<br />
quotations etc.<br />
• Send the contacts a “Thank you” letter for visiting your booth.<br />
• Make a second mailing several months after the first one, to remind your contact that you<br />
are at his disposal to answer any inquiry. Eventually make the contact a “special offer”!<br />
Import Promotion Organisations, Branch Organisations, Test Institutes, Commercial Departments<br />
of Embassies, Consulates, and related business consultants of the table- & kitchenware sector<br />
may be of help in providing information about relevant trade fairs. A detailed list of trade fairs is<br />
given in Appendix 4.3 of this <strong>market</strong> <strong>survey</strong>. Some of these organisations and/or persons may<br />
also advise and/or assist the exporter in his participation in a trade fair. For further information,<br />
we also refer to the International Trade Centre publication “International Craft Trade Fairs: A<br />
Practical Guide”. The guide can be obtained on their site www.intracen.org. Also check the<br />
CBI’s export manual “Your Image Builder”.<br />
101
APPENDIX 1<br />
HS NOMENCLATURE<br />
The list of developing countries as applied in this <strong>market</strong> <strong>survey</strong>, is the OECD DAC list of<br />
countries receiving Official Development Assistance (Part I). The list used is the one as at<br />
1/1/<strong>2003</strong>.<br />
PLASTICWARE<br />
Hs code Description<br />
3924 1000 Tableware and kitchenware, of plastics<br />
9090 Household articles and toilet articles, of plastics other than regenerated cellulose (excl.<br />
Tableware, kitchenware, baths, shower-baths, wash-basins, bidets, lavatory pans, seats<br />
and covers, flushing cisterns and similar sanitary ware)<br />
9019 Household articles and toilet articles, of regenerated cellulose (excl. Tableware,<br />
kitchenware, baths, shower-baths, wash-basins, bidets, lavatory pans, seats and covers,<br />
flushing cisterns and similar sanitary ware)<br />
WOODWARE<br />
Hs code Description<br />
4419 0000 Tableware and kitchenware, of wood (excl. Interior fittings, ornaments, cooperage<br />
products, tableware and kitchenware components of wood, brushes, brooms and hand<br />
sieves)<br />
0010 Tableware and kitchenware, of tropical wood as specified in additional note 2 to this<br />
chapter<br />
0090 Tableware and kitchenware, of wood (excl. 4419.00-10)<br />
CHINA & PORCELAIN<br />
Hs code Description<br />
6911 1000 Tableware and kitchenware, of porcelain or china (excl. Ornamental articles, pots, jars,<br />
carboys and similar receptacles for the conveyance or packing of goods, and coffee<br />
grinders and spice mills with receptacles made of ceramics and working parts<br />
9000 Household and toilet articles, of porcelain or china (excl. Tableware and kitchenware,<br />
baths, bidets, sinks and similar sanitary fixtures, statuettes and other ornamental articles,<br />
pots, jars, carboys and similar receptacles for the conveyance or pac<br />
CERAMICWARE<br />
Hs code Description<br />
6912 0010 Tableware, kitchenware, other household articles and toilet articles, of common pottery<br />
(excl. Statuettes and other ornamental articles, pots, jars, carboys and similar receptacles<br />
for the conveyance or packing of goods, and coffee grinders and spice<br />
0030 Tableware, kitchenware, other household articles and toilet articles, of stoneware (excl.<br />
Baths, bidets, sinks and similar sanitary fixtures, statuettes and other ornamental articles,<br />
pots, jars, carboys and similar receptacles for the conveyance or<br />
0050 Tableware, kitchenware, other household articles and toilet articles, of earthenware or<br />
fine pottery (excl. Baths, bidets, sinks and similar sanitary fixtures, statuettes and other<br />
ornamental articles, pots, jars, carboys and similar receptacles for<br />
0090 Ceramic tableware, kitchenware, other household articles and toilet articles (excl. Sinks,<br />
baths, bidets and similar sanitary fixtures; statuettes and other ornamental articles; pots,<br />
jars, etc. For the conveyance or packing of goods; household mills<br />
102
GLASSWARE<br />
Hs code Description<br />
7013 1000 Glassware of a kind used for table, kitchen, toilet, office, indoor decoration or similar<br />
purposes (excl. Goods of heading 7018, cooking hobs, leaded lights and the like, lighting<br />
fittings and parts thereof, atomizers for perfume and the like)<br />
2111 Drinking glasses of lead crystal, gathered by hand, cut or otherwise decorated<br />
2119 Drinking glasses of lead crystal, gathered by hand (excl. Cut or otherwise decorated)<br />
2191 Drinking glasses of lead crystal, gathered mechanically, cut or otherwise decorated<br />
2199 Drinking glasses of lead crystal, gathered mechanically (excl. Cut or otherwise<br />
decorated)<br />
2910 Drinking glasses of toughened glass (excl. Glasses of glass-ceramics or of lead crystal)<br />
2951 Drinking glasses, gathered by hand, cut or otherwise decorated (excl. Glasses of glassceramics,<br />
lead crystal or toughened glass)<br />
2959 Drinking glasses, gathered by hand (excl. Glasses cut or otherwise decorated, or of glassceramics,<br />
lead crystal or toughened glass)<br />
2991 Drinking glasses, gathered mechanically, cut or otherwise decorated (excl. Glasses of<br />
glass-ceramics, lead crystal or toughened glass)<br />
2999 Drinking glasses, gathered mechanically (excl. Glasses cut or otherwise decorated, or of<br />
glass-ceramics, lead crystal or toughened glass)<br />
3110 Glassware of lead crystal, of a kind used for table or kitchen purposes, gathered by hand<br />
(excl. Articles of heading 7018, drinking glasses, glass preserving jars, sterilizing jars ,<br />
vacuum flasks and other vacuum vessels)<br />
3190 Glassware of lead crystal, of a kind used for table or kitchen purposes, gathered<br />
mechanically (excl. Articles of heading 7018, drinking glasses, glass preserving jars<br />
sterilizing jars , vacuum flasks and other vacuum vessels)<br />
3200 Glassware for table or kitchen purposes of glass having a linear coefficient of expansion<br />
=< 5 x 10 -6 per kelvin within a temperature range of 0 to 300. C (excl. Glassware of<br />
glass-ceramics or lead crystal, articles of heading 7018, drinking glasses)<br />
3910 Glassware for table or kitchen purposes, of toughened glass (excl. Glass having a linear<br />
coefficient of expansion =< 5 x 10 -6 per kelvin within a temperature range of 0 to 300.<br />
C, glassware of glass-ceramics or lead crystal, articles of heading 7018)<br />
3991 Glassware of a kind used for table or kitchen purposes, gathered by hand (excl.<br />
Toughened glass and glass having a linear coefficient of expansion =< 5 x 10 -6 per<br />
kelvin within a temperature range of 0 to 300. C, glassware of glass-ceramics or lead)<br />
3999 Glassware of a kind used for table or kitchen purposes, gathered mechanically (excl.<br />
Toughened glass and glass having a linear coefficient of expansion =< 5 x 10 -6 per<br />
kelvin within a temperature range of 0 to 300. C, glassware of glass-ceramics or lead)<br />
9110 Glassware, of lead crystal, of a kind used for toilet, office, indoor decoration or similar<br />
purposes, gathered by hand (excl. Glassware of a kind used for table or kitchen purposes,<br />
glassware of glass-ceramics or lead crystal, articles of heading 701)<br />
9190 Glassware, of lead crystal, of a kind used for toilet, office, indoor decoration or similar<br />
purposes, gathered mechanically (excl. Glassware of a kind used for table or kitchen<br />
purposes, articles of heading 7018, mirrors, leaded lights and the like)<br />
9900 Glassware of a kind used for toilet, office, indoor decoration or similar purposes (excl.<br />
Glassware of lead crystal or of a kind used for table or kitchen purposes, articles of<br />
heading 7018, mirrors, leaded lights and the like, lighting fittings and the like)<br />
9910 Glassware of a kind used for toilet, office, indoor decoration or similar purposes,<br />
gathered by hand (excl. Glassware of lead crystal or of a kind used for table or kitchen<br />
purposes, articles of heading 7018, mirrors, leaded lights and the like)<br />
9990 Glassware of a kind used for toilet, office, indoor decoration or similar purposes,<br />
gathered mechanically (excl. Glassware of lead crystal or of a kind used for table or<br />
kitchen purposes, articles of heading 7018, mirrors, leaded lights and the like)<br />
103
METALWARE<br />
Hs code Description<br />
7323 9100 Table, kitchen or other household articles, and parts thereof, of cast iron, not enamelled<br />
(excl. Cans, boxes and similar containers of heading 7310; waste baskets; shovels,<br />
corkscrews and other articles of the nature of a work implement; articles of<br />
9200 Table, kitchen or other household articles, and parts thereof, of cast iron, enamelled<br />
(excl. Cans, boxes and similar containers of heading 7310; waste baskets; shovels,<br />
corkscrews and other articles of the nature of a work implement; articles of cut<br />
9310 Articles for table use, of stainless steel (excl. Cans, boxes and similar containers of<br />
heading 7310; corkscrews, nutcrackers and other articles of the nature of a work<br />
implement; articles of cutlery, spoons, ladles, forks etc. Of headings 8211 to 82<br />
9390 Table, kitchen or other household articles, and parts thereof, of stainless steel (excl.<br />
Cans, boxes and similar containers of heading 7310; waste baskets; shovels, corkscrews<br />
and other articles of the nature of a work implement; articles of cutlery,<br />
9410 Articles for table use, of iron other than cast iron or steel, enamelled, spoons, ladles,<br />
forks etc. Of headings 8211 to 8215; ornamental articles (excl. Cans, boxes and similar<br />
containers of heading 7310; spoons, ladles etc. Of heading 8215; ornament)<br />
9490 Table, kitchen or other household articles, and parts thereof, of iron other than cast iron<br />
or steel, enamelled (excl. Cans, boxes and similar containers of heading 7310; waste<br />
baskets; shovels and other articles of the nature of a work implement; sp<br />
9910 Articles for table use, of iron other than cast iron or steel (excl. Enamelled articles; cans,<br />
boxes and similar containers of heading 7310; corkscrews, nutcrackers and other articles<br />
of the nature of a work implement; articles of cutlery, spoons, ladles, forks etc. Of<br />
headings 8211 to 8215)<br />
9991 Table, kitchen or other household articles, and parts thereof, of iron other than cast iron<br />
or steel, varnished or painted (excl. Cans, boxes and similar containers of heading 7310;<br />
waste baskets; shovels and other articles of the nature of a work implement; articles of<br />
cutlery, spoons, ladles, forks etc. Of headings 8211 to 8215)<br />
9999 Table, kitchen or other household articles and parts thereof, of iron, other than cast iron,<br />
or steel (excl. Enamelled, painted or varnished articles; cans, boxes and similar<br />
containers in heading 7310; waste baskets; shovels, corkscrews, waffle iron<br />
7417 0000 Cooking or heating apparatus of a kind used for domestic purposes, non-electric, and<br />
parts thereof, of copper (excl. Hot water heaters and geysers)<br />
7418 1000 Table, kitchen or other household articles, parts thereof, of copper, including pot scourers<br />
and scouring or polishing pads, gloves and the like, of copper (excl. Cooking and heating<br />
appliances of heading 7417, cans, boxes and similar containers)<br />
1900 Table, kitchen or other household articles, parts thereof, of copper (excl. Pot scourers and<br />
scouring or polishing pads, gloves and the like, cooking and heating appliances of<br />
heading no 7417, cans, boxes and similar containers of heading no 7419, ar<br />
7615 1910 Table, kitchen or other household articles, parts thereof, of aluminium, cast (excl. Cans,<br />
boxes and similar containers of heading 7612, articles of the nature of a work implement,<br />
spoons, ladles and other articles of headings 8211 to 8215, ornamental<br />
1990 Table, kitchen or other household articles, parts thereof, of aluminium, uncast (excl. Pot<br />
scourers and scouring or polishing pads, gloves and the like, of aluminium, cans, boxes<br />
and similar containers of heading no 7612, articles of the nature of a work implement;<br />
articles of cutlery, spoons, ladles, forks etc. Of headings 8211 to 8215)<br />
CUTLERY<br />
Hs code Description<br />
8211 1000 Sets of assorted articles of knives of heading no 8211; sets in which there is a higher<br />
number of knives of heading no 8211 than of any other article<br />
9130 Table knives with handle and fixed blade, of stainless steel<br />
9180 Table knives with fixed blade, of base metal (not with handle and blade of stainless steel<br />
and excl. Butter knives and fish knives)<br />
9190 Table knives with fixed blades of base metal (excl. Butter knives and fish knives)<br />
9200 Knives with fixed blades of base metal, incl. Handles (excl. Straw knives, machetes,<br />
knives and cutting blades for machines or mechanical appliances, table knives, fish<br />
knives, butter knives, razors and razor blades and knives of heading no 8214)<br />
104
9290 Knives with fixed blades of base metal (excl. Hay knives, machetes, knives and cutting<br />
blades for machines or mechanical appliances, table knives, fish knives, butter knives,<br />
razors and razor blades and knives of heading no 8214)<br />
9300 Knives having other than fixed blades, of base metal, incl. Handles (excl. Razors)<br />
9390 Knives having other than fixed blades, of base metal (excl. Razors)<br />
9400 Blades of base metal for table knives, pocket knives and other knives of heading no 8211<br />
8215 1010 4sets of spoons, forks or other articles of heading no 8215, incl. Those with up to an<br />
equal number of knives, of stainless steel, containing at least one article plated with<br />
precious metal<br />
1020 Sets of spoons, forks or other articles of heading 8215, which may also contain up to an<br />
equivalent number of knives, of base metal, containing only articles plated with precious<br />
metal<br />
1030 Sets of spoons, forks or other articles of heading 8215, which may also contain up to an<br />
equivalent number of knives, of stainless steel, containing at least one article plated with<br />
precious metal<br />
1080 Sets of spoons, forks or other articles of heading 8215, which may also contain up to an<br />
equivalent number of knives, of base metal other than stainless steel, containing at least<br />
one article plated with precious metal<br />
1090 4sets of spoons, forks or other articles of heading no 8215, incl. Those with up to an<br />
equal number of knives, of base metals other than stainless steel, containing at least one<br />
article plated with precious metal<br />
2010 Sets of spoons, forks or other articles of heading no 8215, incl. Those with up to an equal<br />
number of knives, of stainless steel, containing no articles plated with precious metal<br />
2090 Sets of spoons, forks or other articles of heading no 8215, incl. Those with up to an equal<br />
number of knives, of base metals other than stainless steel, containing no articles plated<br />
with precious metal<br />
9100 Spoons, forks, ladles, skimmers, cake-servers, fish-knives, butter-knives, sugar tongs and<br />
similar kitchen or tableware of base metal, plated with precious metal (excl. Sets of<br />
articles such as lobster cutters and poultry shears)<br />
9910 Spoons, forks, ladles, skimmers, cake-servers, fish-knives, butter-knives, sugar tongs and<br />
similar kitchen or tableware of stainless steel, not plated with precious metal (excl. Sets<br />
of articles such as lobster cutters and poultry shears)<br />
9990 Spoons, forks, ladles, skimmers, cake-servers, fish-knives, butter-knives, sugar tongs and<br />
similar kitchen or tableware of base metals other than stainless steel, not plated with<br />
precious metal (excl. Sets of articles such as lobster cutters and poultry shears)<br />
105
APPENDIX 2<br />
DETAILED IMPORT STATISTICS<br />
The source of the data presented below is Eurostat COMEXT 2002<br />
Import of table- & kitchenware by The EU, 1999-2001 value thousand €/ tons<br />
1999 2000 2001<br />
value € volume value € volume value € volume<br />
Total import 7,663,500 2,624,300 8,466,100 2,481,000 8,368,000 2,539,700<br />
Extra-EU 3,356,000 1,132,900 3,989,200 1,229,800 4,016,300 1,270,800<br />
Developing countries 1,773,500 682,100 2,231,000 747,600 2,330,600 797,900<br />
Plasticware 1,754,500 492,700 1,930,800 518,200 1,963,600 523,500<br />
Woodware 155,600 53,300 183,700 59,900 188,300 60,200<br />
Porcelain & China 769,400 249,500 838,800 275,100 839,000 271,200<br />
Ceramicware 549,500 261,600 588,500 265,900 584,800 273,500<br />
Glassware 1,803,900 1,044,800 1,885,700 810,200 1,852,000 779,900<br />
Metalware 1,797,700 421,800 2,026,900 433,400 2,000,500 419,300<br />
Cutlery 832,900 100,500 1,011,700 118,400 939,800 114,900<br />
Import of table- & kitchenware by the EU, per EU country, 1999-2001 value thousand €/ tons<br />
1999 2000 2001<br />
value € volume value € volume value € volume<br />
EU-total 7,663,500 2,624,300 8,466,100 2,481,000 8,368,000 2,539,700<br />
Germany 1,766,700 552,600 1,977,300 585,100 1,828,700 544,900<br />
United Kingdom 1,107,800 635,000 1,311,300 380,100 1,410,400 404,800<br />
France 1,062,100 354,400 1,156,900 374,300 1,156,600 376,100<br />
Italy 680,300 185,500 724,500 194,800 695,100 186,000<br />
The Netherlands 575,000 220,000 601,600 204,500 623,700 210,500<br />
Spain 523,600 177,500 596,600 204,000 553,500 182,200<br />
Belgium 510,100 146,900 574,300 160,700 547,700 143,000<br />
Austria 435,300 70,900 441,700 73,300 436,600 72,800<br />
Denmark 190,100 51,500 239,300 59,800 254,300 69,000<br />
Sweden 219,300 58,700 246,100 61,800 237,600 65,000<br />
Greece 188,200 63,200 168,100 80,700 178,100 179,900<br />
Portugal 161,800 50,300 158,400 46,200 149,500 44,800<br />
Ireland 123,900 32,400 137,100 28,000 146,700 28,900<br />
Finland 91,000 20,500 100,000 21,300 101,400 20,800<br />
Luxembourg 28,300 4,700 32,800 6,400 48,000 11,000<br />
106
Leading EU suppliers, per EU country, 1999-2001 value thousand €/ tons<br />
1999 2000 2001<br />
value € volume value € volume value € volume<br />
China 1,138,400 386,000 1,458,200 416,400 1,501,700 439,900<br />
Italy 776,600 329,400 843,800 291,200 823,300 385,200<br />
Germany 761,300 295,600 805,500 181,400 779,200 168,500<br />
France 800,000 273,900 795,100 247,200 730,100 216,300<br />
Belgium 494,300 101,600 506,700 115,400 520,800 101,400<br />
Netherlands 401,500 175,000 380,100 106,400 390,700 101,300<br />
Poland 219,200 107,000 260,000 123,600 290,300 130,100<br />
Portugal 240,100 87,800 254,600 84,800 262,900 98,600<br />
United Kingdom 284,400 78,700 294,200 75,300 262,700 50,600<br />
Taiwan 241,400 69,100 275,200 68,500 231,300 56,800<br />
Czech Republic 195,700 73,000 204,200 74,300 220,700 78,000<br />
Thailand 163,000 64,900 218,300 75,300 209,400 72,200<br />
Turkey 138,300 99,000 164,900 120,100 201,400 137,100<br />
Spain 202,400 84,900 198,500 78,700 190,600 76,200<br />
Switzerland 164,300 18,900 184,300 18,800 175,300 16,900<br />
United States 137,400 24,200 148,200 24,300 145,900 23,500<br />
Leading EU Developing Countries suppliers, per EU country, 1999-2001 value thousand €/ tons<br />
1999 2000 2001<br />
value € volume value € volume value € volume<br />
China 1,138,400 386,000 1,458,200 416,400 1,501,700 439,900<br />
Thailand 163,000 64,900 218,300 75,300 209,400 72,200<br />
Turkey 138,300 99,000 164,900 120,100 201,400 137,100<br />
India 54,100 13,200 76,500 17,100 90,500 20,600<br />
Indonesia 80,700 30,800 84,700 24,400 81,000 26,100<br />
Slovenia 33,500 16,300 38,500 18,200 41,700 18,000<br />
Vietnam 15,300 6,300 22,700 7,300 34,500 9,900<br />
Malaysia 19,300 11,200 25,500 14,300 31,900 20,700<br />
Brasil 23,600 13,900 23,400 12,500 21,200 10,200<br />
Bangladesh 8,100 2,800 14,200 3,400 17,700 4,200<br />
Philippines 19,000 6,200 17,700 5,600 12,500 4,400<br />
Tunisia 10,300 3,100 10,600 3,500 10,600 3,600<br />
Serb Mont. 5,900 3,100 6,700 4,700 9,200 6,600<br />
Sri Lanka 8,300 2,500 10,000 2,600 9,900 2,800<br />
South Africa 7,300 1,800 9,600 2,300 8,900 2,100<br />
Mexico 12,300 5,300 10,000 3,800 8,400 3,200<br />
107
Import of table- & kitchenware by France, 1999-2001 value thousand €/ tons<br />
1999 2000 2001<br />
value € volume value € volume value € volume<br />
Total import 1,062,100 354,400 1,156,900 374,300 1,156,600 376,100<br />
Extra-EU 337,700 125,200 406,700 141,200 391,300 135,900<br />
Developing countries 192,000 77,700 242,600 87,400 242,900 88,800<br />
Plasticware 294,600 94,000 313,700 98,200 323,100 96,900<br />
Woodware 22,200 7,700 25,000 8,400 25,000 7,600<br />
Porcelain & China 97,500 32,900 106,600 36,000 106,900 35,400<br />
Ceramicware 109,300 52,900 114,200 55,300 110,800 55,300<br />
Glassware 199,700 99,800 216,600 103,400 223,300 108,800<br />
Metalware 240,200 55,100 266,800 59,400 267,200 59,900<br />
Cutlery 98,600 12,200 114,100 13,600 100,300 12,300<br />
Import of table- & kitchenware by The United Kingdom, 1999-2001 value €/ thousand tons<br />
1999 2000 2001<br />
value € volume value € volume value € volume<br />
Total import 1,107,800 635,000 1,311,300 380,100 1,410,400 404,800<br />
Extra-EU 641,000 189,700 810,600 216,100 869,500 247,500<br />
Developing countries 388,300 128,100 513,700 150,100 586,300 184,700<br />
Plasticware 253,400 83,700 299,600 93,900 300,200 101,700<br />
Woodware 36,000 11,500 47,000 13,900 52,600 16,500<br />
Porcelain & China 70,800 19,300 92,600 26,300 100,900 31,400<br />
Ceramicware 107,700 51,500 121,600 50,200 138,700 67,700<br />
Glassware 236,000 372,400 261,200 109,700 279,600 94,800<br />
Metalware 283,000 78,200 338,000 64,600 376,600 69,300<br />
Cutlery 120,900 18,400 151,300 21,600 161,800 23,500<br />
Import of table- & kitchenware by Italy, 1999-2001 value thousand €/ tons<br />
1999 2000 2001<br />
value € volume value € volume value € volume<br />
Total import 680,300 185,500 724,500 194,800 695,100 186,000<br />
Extra-EU 278,600 97,000 323,000 105,800 337,000 112,200<br />
Developing countries 190,000 65,900 186,500 73,300 190,000 76,200<br />
Plasticware 92,600 21,600 103,600 21,500 98,900 18,800<br />
Woodware 12,500 4,200 13,100 4,500 13,300 4,200<br />
Porcelain & China 145,600 36,500 149,500 38,100 145,000 39,000<br />
Ceramicware 38,700 15,600 35,500 13,800 30,000 13,000<br />
Glassware 225,200 79,600 229,100 84,900 223,600 83,200<br />
Metalware 100,100 20,500 110,700 21,400 104,100 18,500<br />
Cutlery 65,600 7,600 83,000 10,500 80,200 9,300<br />
108
Import of table- & kitchenware by Germany, 1999-2001 value thousand €/ tons<br />
1999 2000 2001<br />
value € volume value € volume value € volume<br />
Total import 1,766,700 552,600 1,977,300 585,100 1,828,700 544,900<br />
Extra-EU 977,400 327,700 1,160,400 356,000 1,103,500 343,900<br />
Developing countries 477,300 165,200 592,800 179,300 564,800 170,600<br />
Plasticware 455,500 117,200 500,100 120,100 458,200 106,600<br />
Woodware 31,400 12,500 34,400 12,800 31,800 12,200<br />
Porcelain & China 147,000 50,500 159,500 54,900 168,500 54,100<br />
Ceramicware 87,400 48,900 93,600 51,400 85,300 47,300<br />
Glassware 384,300 193,000 400,100 204,200 366,200 195,100<br />
Metalware 433,300 104,900 516,500 113,000 477,600 103,200<br />
Cutlery 227,800 25,600 273,200 28,700 241,300 26,400<br />
Import of table- & kitchenware by Spain, 1999-2001 value thousand €/ thousand tons<br />
1999 2000 2001<br />
value € volume value € volume value € volume<br />
Total import 523,600 177,500 596,600 204,000 553,500 182,200<br />
Extra-EU 193,200 83,000 209,700 78,600 219,200 79,300<br />
Developing countries 111,700 55,400 122,900 50,200 139,100 52,900<br />
Plasticware 76,300 26,900 98,100 33,600 90,400 28,700<br />
Woodware 5,900 1,900 8,100 2,600 7,700 2,600<br />
Porcelain & China 63,400 24,200 81,900 37,400 80,200 27,500<br />
Ceramicware 39,100 20,400 36,700 19,000 34,900 17,200<br />
Glassware 142,600 64,600 140,900 65,700 142,200 68,900<br />
Metalware 140,600 31,900 160,800 36,200 135,600 28,900<br />
Cutlery 55,700 7,500 70,100 9,500 62,400 8,500<br />
Import of table- & kitchenware by The Netherlands, 1999-2001 value thousand €/ tons<br />
1999 2000 2001<br />
value € volume value € volume value € volume<br />
Total import 575,000 220,000 601,600 204,500 623,700 210,500<br />
Extra-EU 296,300 112,600 328,300 118,700 341,400 128,500<br />
Developing countries 147,100 63,600 201,000 73,400 222,500 82,600<br />
Plasticware 126,300 41,200 123,700 36,600 139,300 38,500<br />
Woodware 10,400 4,700 13,200 5,800 12,900 4,200<br />
Porcelain & China 44,700 22,900 41,400 21,900 43,600 24,500<br />
Ceramicware 35,600 18,900 54,200 21,700 60,300 23,700<br />
Glassware 114,800 79,400 126,400 68,800 125,400 70,700<br />
Metalware 170,100 42,800 165,700 39,400 166,600 37,600<br />
Cutlery 73,200 10,200 77,000 10,300 75,600 11,100<br />
109
APPENDIX 3<br />
DETAILED EXPORT STATISTICS<br />
The source of the data presented below is Eurostat COMEXT 2002<br />
Export of table- & kitchenware by The EU, 1999-2001 value thousand €/ tons<br />
1999 2000 2001<br />
value € volume value € volume value € volume<br />
Total export 7,938,100 2,243,600 8,648,700 2,320,100 8,604,700 2,013,700<br />
Intra-EU 4,581,000 1,509,100 4,581,000 1,504,700 4,581,000 1,203,000<br />
Extra-EU 3,357,100 734,500 4,067,800 815,400 4,023,700 810,700<br />
Plasticware 1,490,800 375,600 1,579,200 373,100 1,647,500 370,100<br />
Woodware 69,200 16,100 81,700 17,900 74,700 15,200<br />
Porcelain & China 832,400 195,700 930,800 278,000 899,100 126,100<br />
Ceramicware 653,600 265,400 706,300 299,000 670,700 240,500<br />
Glassware 2,553,100 1,032,200 2,748,000 957,300 2,681,200 868,800<br />
Metalware 1,746,200 314,000 1,946,200 343,600 1,986,100 342,700<br />
Cutlery 592,800 44,600 656,700 51,200 645,300 50,500<br />
Export of table- & kitchenware by the EU, per EU country, 1999-2001 value thousand €/ tons<br />
1999 2000 2001<br />
value € volume value € volume value € volume<br />
EU 7,938,100 2,243,600 8,648,700 2,320,100 8,604,700 2,013,700<br />
France 1,736,300 494,300 1,847,600 518,800 1,851,900 506,300<br />
Italy 1,526,600 472,500 1,691,700 502,200 1,741,400 492,300<br />
Germany 1,407,600 240,100 1,536,200 262,900 1,484,000 251,700<br />
Belgium 675,300 158,100 754,000 170,200 751,400 160,400<br />
United Kingdom 725,200 354,100 767,900 136,100 709,600 105,100<br />
Netherlands 416,200 117,600 434,300 111,900 422,900 106,700<br />
Spain 333,100 200,000 388,200 148,600 377,000 143,700<br />
Austria 292,700 32,400 332,300 40,700 333,400 43,000<br />
Portugal 286,000 99,900 312,500 114,000 314,900 115,700<br />
Sweden 179,500 35,400 200,000 36,200 189,700 38,100<br />
Denmark 133,100 15,000 177,800 255,200 178,600 20,000<br />
Ireland 131,200 5,800 114,600 4,200 129,000 5,800<br />
Luxembourg 17,000 2,000 15,500 2,300 48,000 8,300<br />
Finland 41,400 6,100 46,000 6,300 44,300 6,300<br />
Greece 36,900 10,300 30,200 10,600 28,600 10,300<br />
110
Export of table- & kitchenware by France, 1999-2001 value thousand €/ tons<br />
1999 2000 2001<br />
value € volume value € volume value € volume<br />
Total export 1,736,300 494,300 1,847,600 518,800 1,851,900 506,300<br />
Intra-EU 884,100 264,100 867,500 263,500 869,700 251,700<br />
Extra-EU 852,100 230,200 980,100 255,300 982,200 254,500<br />
Plasticware 216,500 35,100 237,700 37,200 247,100 37,600<br />
Woodware 6,600 1,400 7,700 1,500 8,000 1,500<br />
Porcelain & China 117,800 12,800 127,600 12,500 129,500 11,200<br />
Ceramicware 51,500 11,500 59,100 13,300 69,100 15,300<br />
Glassware 921,900 382,500 961,400 400,600 956,400 389,300<br />
Metalware 330,600 46,400 363,700 49,100 353,800 47,200<br />
Cutlery 91,300 4,600 90,500 4,400 88,000 4,200<br />
Export of table- & kitchenware by The United Kingdom, 1999-2001 value thousand €/ tons<br />
1999 2000 2001<br />
value € volume value € volume value € volume<br />
Total export 725,200 354,100 767,900 136,100 709,600 105,100<br />
Intra-EU 378,100 312,100 371,300 90,800 338,300 64,800<br />
Extra-EU 347,100 42,000 396,600 45,300 371,300 40,300<br />
Plasticware 134,100 35,600 125,600 26,300 124,300 25,200<br />
Woodware 11,600 3,800 13,100 2,900 9,600 1,400<br />
Porcelain & China 153,700 10,400 179,800 10,700 188,600 11,700<br />
Ceramicware 227,900 45,700 239,300 38,400 200,900 30,300<br />
Glassware 94,900 235,000 97,800 41,600 69,500 17,000<br />
Metalware 53,000 14,300 56,500 10,200 62,000 8,700<br />
Cutlery 50,100 9,400 55,700 6,000 54,800 10,900<br />
Export of table- & kitchenware by Italy, 1999-2001 value thousand €/ tons<br />
1999 2000 2001<br />
value € volume value € volume value € volume<br />
Total export 1,526,600 472,500 1,691,700 502,200 1,741,400 492,300<br />
Intra-EU 831,200 254,800 853,200 260,700 832,400 252,700<br />
Extra-EU 695,400 217,700 838,500 241,500 909,000 239,600<br />
Plasticware 233,900 82,100 263,800 91,300 275,000 92,400<br />
Woodware 11,400 1,400 11,800 2,000 9,600 1,300<br />
Porcelain & China 61,500 16,800 76,400 22,100 78,200 20,200<br />
Ceramicware 168,300 118,700 183,000 110,700 177,500 96,100<br />
Glassware 369,100 131,300 396,000 142,400 408,000 146,000<br />
Metalware 597,600 115,700 666,800 126,100 703,300 129,100<br />
Cutlery 84,700 6,400 93,900 7,600 89,900 7,200<br />
111
Export of table- & kitchenware by Germany, 1999-2001 value thousand €/ tons<br />
1999 2000 2001<br />
value € volume value € volume value € volume<br />
Total export 1,407,600 240,100 1,536,200 262,900 1,484,000 251,700<br />
Intra-EU 755,400 136,500 801,100 150,700 753,900 139,900<br />
Extra-EU 652,200 103,600 735,100 112,200 730,100 111,800<br />
Plasticware 205,300 50,100 217,800 51,500 215,700 46,300<br />
Woodware 8,200 1,800 9,000 2,100 10,100 2,100<br />
Porcelain & China 312,600 42,200 336,600 41,900 304,200 38,100<br />
Ceramicware 32,500 8,100 34,800 9,900 33,600 9,000<br />
Glassware 399,300 92,800 434,400 108,600 411,200 108,200<br />
Metalware 262,200 38,000 301,700 41,700 301,200 40,000<br />
Cutlery 187,400 7,200 201,900 7,300 208,000 7,900<br />
Export of table- & kitchenware by Spain, 1999-2001 value thousand €/ tons<br />
1999 2000 2001<br />
value € volume value € volume value € volume<br />
Total export 333,100 200,000 388,200 148,600 377,000 143,700<br />
Intra-EU 217,600 163,400 250,800 105,100 223,900 95,200<br />
Extra-EU 115,500 36,600 137,400 43,500 153,200 48,500<br />
Plasticware 66,900 21,800 93,100 28,600 92,100 29,600<br />
Woodware 4,500 1,000 5,700 1,300 4,300 1,100<br />
Porcelain & China 17,400 72,900 16,000 4,800 16,900 6,000<br />
Ceramicware 11,000 5,800 13,300 7,100 12,900 6,600<br />
Glassware 109,500 73,800 120,800 79,700 114,800 73,400<br />
Metalware 95,200 22,900 105,000 24,800 103,300 24,800<br />
Cutlery 28,700 1,800 34,400 2,200 32,800 2,200<br />
Export of table- & kitchenware by The Netherlands, 1999-2001 value thousand €/ tons<br />
1999 2000 2001<br />
value € volume value € volume value € volume<br />
Total export 416,200 117,600 434,300 111,900 422,900 106,700<br />
Intra-EU 337,600 103,800 338,900 95,800 334,100 90,900<br />
Extra-EU 78,600 13,900 95,500 16,100 88,800 15,800<br />
Plasticware 128,500 40,500 118,600 33,300 112,000 29,400<br />
Woodware 4,400 1,000 4,700 1,100 4,900 1,200<br />
Porcelain & China 41,100 15,700 42,300 14,500 41,500 14,600<br />
Ceramicware 15,200 10,000 15,900 10,000 14,200 8,200<br />
Glassware 93,200 24,500 112,100 25,100 114,900 26,700<br />
Metalware 91,000 20,600 95,800 22,300 92,000 21,100<br />
Cutlery 42,800 5,500 44,800 5,500 43,400 5,600<br />
112
APPENDIX 4.1<br />
STANDARDS ORGANISATIONS<br />
INTERNATIONAL<br />
International Organisation for Standardization (ISO)<br />
E-mail: central@iso.org<br />
Internet: www.iso.org<br />
EUROPEAN UNION<br />
Comité Européen de Normalisation (CEN)<br />
European Normalisation Committee<br />
E-mail: infodesk@cenorm.be<br />
Internet: www.cenorm.be<br />
SGS Société Générale de Surveillance (SA)<br />
E-mail: enquiries@sgs.com<br />
Internet: www.sgs.com<br />
GERMANY<br />
D<strong>eu</strong>tsches Institut für Normung (DIN)<br />
E-mail: directorate.international@din.de<br />
Internet: www.din.de<br />
RAL D<strong>eu</strong>tsches Institut für Gütesicherung & Kennzeichnung<br />
E-mail: RAL-Institut@t-online.de<br />
Internet: www.ral.de<br />
UNITED KINGDOM<br />
British Standards Institution (BSI)<br />
E-mail: standards.international@ bsi-global.com<br />
Internet: www.bsi-global.com<br />
FRANCE<br />
Association Française de Normalisation (AFNOR)<br />
E-mail: uari@afnor.fr<br />
Internet: www.afnor.fr<br />
ITALY<br />
Ente Nazionale Italiano di Unificazione (UNI)<br />
E-mail: uni@uni.com<br />
Internet: www.uni.com<br />
THE NETHERLANDS<br />
Nederlands Normalisatie Instituut (NEN)<br />
E-mail: info@nen.nl<br />
Internet: www.nen.nl<br />
SPAIN<br />
Asocianión Española de Normalización y certification (AENOR)<br />
E-mail: aenor@aenor.es<br />
Internet: www.aenor.es<br />
113
APPENDIX 4.2<br />
TRADE ASSOCIATIONS<br />
EUROPEAN UNION<br />
Federation of the European Cutlery, Flatware, Holloware and Cookware industries (FEC)<br />
E-mail: unitam@mail.fimeca.com<br />
E-mail: info@ivsh.de<br />
Internet: www.fecinfo.org<br />
Fédération Européenne. des Industries de Porcelaine et de Faience de Table et d’Ornamentation<br />
(European Federation for Table- and Ornamentalware)<br />
E-mail: sec@ceram<strong>eu</strong>nie.net<br />
Internet: www.fepf.web.at.it<br />
Standing Committee of the European Glass Industries Comité<br />
E-mail: info@cpivglass.be<br />
Internet: www.cpivglass.be<br />
FRANCE<br />
Syndicat National de la Porcelaine Française<br />
Telephone: N.A.<br />
Fax :<br />
N.A.<br />
E-mail : carreau@ceramique.org<br />
GERMANY<br />
German Association of Cutlery, Flatware and houseware Industry (IVSH)<br />
E-mail: info@ivsh.de<br />
Internet: www.ivsh.de<br />
Verband der Keramische n Industrie e.V. (VKI)<br />
(Association of German manufactures in the German Industry)<br />
E-mail: infor@keramverband.de<br />
Internet: www.keramverbaende.de/vki<br />
ITALY<br />
Federceramica Associazione Nationale Imprese Della Ceramica E Degli Abrasivi<br />
(The European Abrasives Producers’ Federation)<br />
E-mail federceramica@federchimica.it<br />
Internet: www.federceramica.federchimica.it<br />
Associazione Nazionale degli Industriali del Vetro (ASSOVETRO)<br />
(Association of Italian glass manufacturers)<br />
Telephone: +39-06 488 09 47<br />
Fax: +39-06 420 11 162<br />
E-Mail: Assovetro@tin.it<br />
UNITED KINGDOM<br />
British Hardware & Housewares Manufacturers’ Association<br />
E-mail: bhhma@brookehouse.co.uk<br />
Internet: www.bhhma.com<br />
British Cutlery and Silverware Association (BCSA)<br />
E-mail: cathysteele@secas.co.uk<br />
Internet: www.bja.org.uk/jewellery_in_britain/<br />
British Ceramic Gift and Tableware Manufacturers Association<br />
E-mail: bcc@ceramfed.co.uk<br />
Internet: www.ceramfed.co.uk<br />
114
British Glass Manufacturers Association - BGMA<br />
E-Mail: info@britglass.co.uk<br />
Internet: www.britglass.co.uk<br />
THE NETHERLANDS<br />
Gemengde Branche – Gebra<br />
(Mixed Branch Association)<br />
E-mail: info@gebra.nl<br />
Internet: http://www.gebra.nl<br />
Vereniging van Nederlandse Glasfabrikanten (VNG)<br />
Telephone: +31 (0)59 8313211<br />
Fax: +31 (0)598 39 96 49<br />
E-Mail: Vanderwoude@ppg.com<br />
Algemene vereniging voor de Nederlandse Aardewerk-Industrie<br />
Telephone: +31(0)26 442 82 22<br />
Fax +31(0)26 445 45 39<br />
E-mail: sko@bart.nl<br />
115
APPENDIX 4.3<br />
TRADE FAIR ORGANISERS<br />
GERMANY<br />
Ambiente<br />
Location:<br />
Organisation:<br />
E-mail:<br />
Internet:<br />
Sector:<br />
Tendence<br />
Location:<br />
Organisation:<br />
E-mail:<br />
Internet:<br />
Sector:<br />
(February)<br />
Frankfurt am Main, Germany<br />
Messe Frankfurt GmbH<br />
ambiente@messefrankfurt.com, www.ambiente.messefrankurt.com<br />
www.ambiente-frankfurt.de<br />
Table art, table- & kitchenwares, gourmet shop, table decoration and accessories, interior<br />
design, giftware, jewellery, paper ware, perfume, accessories.<br />
(August)<br />
Frankfurt am Main, Germany<br />
Messe Frankfurt GmbH<br />
tendence@messefrankfurt.com<br />
www.tendence-lifestyle.messefrankfurt.de<br />
Table art, table- & kitchenwares, gourmet shop, table decoration and accessories, interior<br />
design, giftware, jewellery, paper ware, perfume, accessories.<br />
UNITED KINGDOM<br />
Harrogate Home & Gift (July)<br />
Location: Harrogate, United Kingdom<br />
Organisation: Clarion Event<br />
E-mail: homeandgift@eco.co.uk<br />
Internet: www.homeandgift.co.uk<br />
Sector: giftware, jewellery, greeting cards, gift stationery, pictures and prints, home accessories,<br />
china, ceramics, glass and gardenware<br />
Spring Fair Birmingham (February)<br />
Location: Birmingham, United Kingdom<br />
Organisation: Trade Promotion Services Ltd<br />
E-mail: info@emap.com<br />
Internet: www.springfair.com<br />
Sector: General giftware, jewellery, watches, china and glass, fashion accessories, leather, frames<br />
and fine art.<br />
FRANCE<br />
Maison & Objet (September and January)<br />
Location: Paris Nord-Villepinte, France<br />
Organisation: SAFI<br />
E-mail: info@maison-objet.com<br />
Internet: www.maison-objet.com<br />
Sector: International home decoration, and textiles, fragrances, arts and crafts, games, and<br />
stationery.<br />
ITALY<br />
Florence Gift Market (April/ Mai)<br />
Location: Florence, Italy<br />
Organisation: Florence Mart S.R.L.<br />
E-mail: florencemart@florencemart.it<br />
Internet: www.florencemart.it<br />
Sector: International handicraft fair: home furnishing, textile and metal articles, costume<br />
jewellery, ceramics, leather and fur articles.<br />
116
MACEF (September and January/February)<br />
Location: Milan, Italy<br />
Organisation: FMI - Fiera Milano International S.p.a.<br />
E-mail: macef@fmi.it<br />
Internet: www.macefautunno.biz<br />
Sector: Tableware, kitchenware, glass, artificial flowers and plants, wickerwork, candles, gifts,<br />
home decoration, cermamics, porcelain, pictures, frames and home textiles<br />
THE NETHERLANDS<br />
Huishoudb<strong>eu</strong>rs (March)<br />
Organisation: RAI<br />
Location: Amsterdam, The Netherlands<br />
E-mail: huishoudb<strong>eu</strong>rsinfo@rai.nl<br />
Internet: www.huishoudb<strong>eu</strong>rs.rai.nl<br />
Sector: Home decoration, fashion and accessories, table- and kitchenware<br />
SPAIN<br />
Expohogar Regalo oño (September)<br />
Location: Barcelona, Spain<br />
Organisation: Fira Barcelona<br />
E-mail: www.servifira@firabcn.es<br />
Internet: www.expohogar.com<br />
Sector: International trade fair for gifts, house and home: gifts, arts, crafts, crystal, glass, china,<br />
pottery, tableware, furnishings, lighting and household appliances.<br />
117
APPENDIX 4.4<br />
TRADE PRESS<br />
GERMANY<br />
Schöner Wohnen<br />
Telephone: +49 (0)40 3703 4041<br />
Internet: www.livingathome.de<br />
Content: Living and interior decoration<br />
Publication: Monthly<br />
Stil & Markt<br />
E-mail:<br />
Internet:<br />
Content:<br />
Publication:<br />
stilundmarkt@meisenbach.de<br />
www.meisenbach.de<br />
gifts, table- and houseware, lifestyle<br />
Monthly<br />
Das Haus<br />
interior decoration<br />
E-mail: service1@dashaus.burda.com<br />
Internet: www.haus.de<br />
Content: interior decoration, garden<br />
Publication: Monthly<br />
Wohnidee - Wohnen und Leben<br />
E-mail: info@wohnidee.de<br />
Internet: www.wohnidee.de<br />
Content: interior decoration, gifts<br />
Publication: Monthly<br />
Elle Decoration<br />
E-mail:<br />
Internet:<br />
Content:<br />
Publication:<br />
service@burdadirect.de<br />
www.elle.de<br />
Fashion, cultur<br />
Monthly<br />
UNITED KINGDOM<br />
Tableware International<br />
Internet: www. www.dmgworldmedia.com<br />
Content: houseware, tableware, gifts<br />
Publication: Monthly<br />
English Homes<br />
E-mail:<br />
Internet:<br />
Content:<br />
Publication:<br />
info@international-homes.com<br />
www.international-homes.com<br />
Home and lifestyle<br />
Monthly<br />
The English home<br />
Telephone: +20 (0)7751 4800<br />
Internet: www.theenglishhome.co.uk<br />
Content: Interior design and decoration, furnishing<br />
Publication: Monthly<br />
118
FRANCE<br />
Art & Decoration<br />
Internet: www.art-decoration.fr<br />
Content: decoration, hobby and art<br />
Publication: Monthly<br />
Cuisines & Bains<br />
E-mail: contact@homeconfort.com<br />
Internet: www.cuisinebain.com<br />
Content: Kitchen and bathing<br />
Publication: Monthly<br />
Elle Decoration France<br />
E-mail: ellemagazine@hfp.fr<br />
Internet: www.elle.fr<br />
Content: Fashion, beauty, interior decoration, home<br />
Publication: Monthly<br />
ITALY<br />
Elle decor<br />
E-mail:<br />
Internet:<br />
Content:<br />
Publication:<br />
Spazio Casa<br />
E-mail:<br />
Internet:<br />
Content:<br />
Publication:<br />
www.elle.it<br />
vendite.milano@rusconi.it<br />
Fashion, beauty, interior decoration, home<br />
10 issues yearly<br />
www.spazio-casa.it<br />
info@spazio-casa.it<br />
style, interior decoration, home<br />
quarterly<br />
THE NETHERLANDS<br />
Eigen huis & interi<strong>eu</strong>r<br />
E-mail: redactie@vtwonen.nl<br />
Internet : www.vtwonen.nl<br />
Content: Living, home decoration<br />
Publication: Monthly<br />
Ariadne at home<br />
Telephone: ariande@sanoma-uitgevers.nl<br />
Internet: www.ariandeathome.com<br />
Content: Living, home decoration<br />
Publication: Monthly<br />
Home and garden<br />
E-mail: homeandgarden@sanorma-uitgevers.nl<br />
Internet: www.homeandgarden.nl<br />
Content: Garden and home decoration<br />
Publication: Monthly<br />
SPAIN<br />
Casa diez<br />
E-mail:<br />
Internet:<br />
Content:<br />
Publication:<br />
casadieze@hachette.es<br />
www.casadiez.navegalia.es<br />
Home decoration<br />
Monthly<br />
119
APPENDIX 4.5<br />
OTHER USEFUL ADDRESSES<br />
INTERNATIONAL<br />
Euromonitor International<br />
E-mail: info@<strong>eu</strong>romonitor<br />
Internet: www.<strong>eu</strong>romonitor.com<br />
International Chamber of Commerce<br />
E-mail: webmaster@iccwbo.org<br />
Internet: www.iccwbo.org<br />
International Trade Centre UNCTAD/ WTO<br />
E-mail: tirc@intracen.org<br />
Internet: www.intracen.org<br />
International Labour Organisation<br />
E-mail: ilo@ilo.org<br />
Internet: www.ilo.org<br />
Mintel International Group Ltd,<br />
E-mail: info@mintel.com<br />
Internet: www.mintel.com<br />
Marketing Directions, Inc.<br />
E-mail: info@trendcurve.com<br />
Internet: www.trendcurve.com<br />
SKAL<br />
Internationally operating inspecting and certifying organisation)<br />
E-mail: info@skal.nl<br />
Internet: www.skal.com<br />
EUROPE<br />
Commission of the European Communities<br />
E-mail: ecolabel@cec.<strong>eu</strong>.int<br />
Internet: www.<strong>eu</strong>ropa.<strong>eu</strong>.int/ecolabel<br />
Trend Trendhub Ltd,<br />
E-mail: consultancy@trendhub.com<br />
Internet: www.trendhub.com<br />
GERMANY<br />
D<strong>eu</strong>tsche Gesellschaft für Technische Zusammenarbeit (GTZ) GmbH<br />
E-mail: Internet-Team@gtz.de<br />
Internet: www.gtz.de<br />
THE NETHERLANDS<br />
CBI/AccessGuide<br />
(CBI’s database on European non-tariff trade barriers)<br />
E-mail: accessguide@cbi.nl<br />
Internet: www.cbi.nl/accessguide<br />
Netherlands Ecolabel enquiry point<br />
E-mail: mili<strong>eu</strong>k<strong>eu</strong>r@mili<strong>eu</strong>k<strong>eu</strong>r.nl<br />
Internet: www.mili<strong>eu</strong>k<strong>eu</strong>r.nl<br />
120
Verwey Chemical Laboratory<br />
(Testing of products)<br />
E-mail: info@drverwey.nl<br />
Internet: www.drverwey.nl<br />
www.dmgworldmedia.com<br />
Dmg world media is the name behind over 260 of the biggest public shows and trade exhibitions worldwide<br />
and a diverse mix of conferences, publications and on-line services. Dmg world media offers <strong>market</strong><br />
reports and other publications serving regional and international <strong>market</strong> sectors around the world.<br />
www.tradeport.org<br />
This site is designed to be an easy-to-use tool offering one place to go for comprehensive trade information,<br />
trade leads, and company databases worldwide. The site contains comprehensive trade directories offering<br />
company search, <strong>market</strong> reports on many countries / sectors and much ore information.<br />
www.<strong>market</strong>file.com<br />
On this site you will find details on Market Tracking International's (MTI) range of <strong>market</strong> research and<br />
consultancy services. Market Tracking International can supply <strong>market</strong> data as printed reports, CD-ROMs,<br />
e-mail attachments, and offers several comprehensive on-line database services, under the MarketFile<br />
brand.<br />
www.housewares.org<br />
This is the official site of the National Housewares Manufacturers Association. This site is more intended<br />
for American manufacturers, although there are also addresses mentioned for European Associations for<br />
Housewares and European traders.<br />
www.gourmetretailer.com<br />
This site is specially created for retailers in the specialty food and housewares industries. On our site, you<br />
will find the latest industry news, trade show dates and information, links to industry associations, webexclusive<br />
articles, and a searchable archive of hundreds of articles from The Gourmet Retailer print edition.<br />
www.dmg.co.uk/tableware<br />
dmg.co.uk/tableware is an internet site with information about the magazine “Tableware International”.<br />
Here you will find news, brands new products, trade exhibitions and subscription details.<br />
121
APPENDIX 5<br />
LIST OF DEVELOPING COUNTRIES<br />
The list of developing countries as applied in this <strong>market</strong> <strong>survey</strong>, is the OECD DAC list of<br />
countries receiving Official Development Assistance (Part I), The list used is the one as at<br />
1/1/<strong>2003</strong>.<br />
Africa Senegal Papua New Guinea Ecuador<br />
Algeria Seychelles Philippines El Salvador<br />
Angola Sierra Leone Saudi Arabia Grenada<br />
Benin Somalia Sri Lanka Guatemala<br />
Botswana South Africa Syria Guyana<br />
Burkina Faso St, Helena Tajikistan Haiti<br />
Burundi Sudan Thailand Honduras<br />
Cameroon Swaziland Turkey Jamaica<br />
Cape Verde Tanzania Turkmenistan Mexico<br />
Central African rep, Togo Uzbekistan Montserrat<br />
Chad Tunisia Vietnam Nicaragua<br />
Comoros Uganda Yemen Panama<br />
Congo, Dem, Rep Zambia Paraguay<br />
Congo, Rep, Zimbabwe Europe<br />
Côte d'Ivoire Albania Peru<br />
Djibouti Asia Armenia St, Kitts-Nevis<br />
Egypt Afghanistan Azerbaijan St, Lucia<br />
Equatorial Guinea Bahrain Bosnia & Herzegovina St, Vincent and Grenadines<br />
Eritrea Bangladesh Croatia Surinam<br />
Ethiopia Bhutan Georgia Trinidad & Tobago<br />
Gabon Cambodia Macedonia Turks & Caicos Islands<br />
Gambia China Malta Uruguay<br />
Ghana East Timor Moldova Venezuela<br />
Guinea India Slovenia<br />
Guinea-Bissau Indonesia Serbia & Montenegro Oceania<br />
Kenya Iran Yugoslavia, Fed, Rep, Cook Islands<br />
Lesotho Iraq Fiji<br />
Liberia Jordan Latin America Kiribati<br />
Madagascar Kazakhstan Anguilla Marshall Islands<br />
Malawi Korea, Rep. of Antigua and Barbuda Micronesia, Fed, States<br />
Mali Kyrghyz Rep. Argentina Nauru<br />
Mauritania Laos Barbados Niue<br />
Mauritius Lebanon Belize Palau Islands<br />
Mayotte Malaysia Bolivia Solomon Islands<br />
Morocco Maldives Brazil Tokelau<br />
Mozambique Mongolia Chile Tonga<br />
Namibia Myanmar Colombia Tuvalu<br />
Niger Nepal Costa Rica Vanuatu<br />
Nigeria Oman Cuba Wallis & Futuna<br />
Rwanda Pakistan Dominica Western Samoa<br />
São Tomé & Principe Palestinian Admin, Areas Dominican republic<br />
122
APPENDIX 6<br />
LIST OF ACP COUNTRIES<br />
The list used is the one as at 1/1/2000<br />
Angola<br />
Antigua And Barbuda<br />
Bahamas<br />
Barbados<br />
Belize<br />
Benin<br />
Botswana<br />
Burkina Faso<br />
Burundi<br />
Cape Verde<br />
Cameroon<br />
Comoros<br />
Congo<br />
Congo Democratic Republic<br />
Cook Islands<br />
Côte D'ivoire<br />
Djibouti<br />
Dominica<br />
Eritrea<br />
Ethiopia<br />
Fiji<br />
Gabon<br />
Gambia, The<br />
Ghana<br />
Grenada<br />
Guinea<br />
Guinea Equatorial<br />
Guinea-Bissau<br />
Guyana<br />
Haiti<br />
Jamaica<br />
Kenya<br />
Kiribati<br />
Lesotho<br />
Liberia<br />
Madagascar<br />
Malawi<br />
Mali<br />
Marshall Islands<br />
Mauritania<br />
Mauritius<br />
Micronesia (Federated States Of)<br />
Mozambique<br />
Namibia<br />
Nauru<br />
Niger<br />
Nigeria<br />
Niue<br />
Palau<br />
Papua New Guinea<br />
Republic Dominican<br />
Central Africa. Rep.<br />
Rwanda<br />
Sao Tome E Principe<br />
Senegal<br />
Seychelles<br />
Sierra Leone<br />
Solomon Islands<br />
Somalia<br />
South Africa<br />
St Kitts And Nevis<br />
St Lucia<br />
St Vincent And The Grenadines<br />
Sudan<br />
Suriname<br />
Swaziland<br />
Tanzania<br />
Chad<br />
Togo<br />
Tonga<br />
Trinidad And Tobago<br />
Tuvalu<br />
Uganda<br />
Vanuatu<br />
Western Samoa<br />
Zambia<br />
Zimbabwe<br />
123
APPENDIX 7<br />
LIST OF GSP COUNTRIES<br />
The following countries, territories and associations of countries eligible for treatment as one<br />
country are designated beneficiary developing countries for the purposes of the Generalized<br />
System of Preferences.<br />
Independent Estonia Oman Zimbabwe<br />
countries<br />
Albania Ethiopia Pakistan<br />
Non-Independent Countries<br />
Angola Fiji Panama<br />
and Territories<br />
Antigua and Barbuda Gabon Papua New Guinea Anguilla<br />
Argentina Gambia Paraguay British Indian Ocean Territory<br />
Armenia Georgia Peru Christmas Island (Australia)<br />
Bahrain Ghana Philippines Cocos (Keeling) Islands<br />
Bangladesh Grenada Poland Cook Islands<br />
Barbados Guatemala Romania Falkland Islands (Islas<br />
Malvinas)<br />
Belize Guinea Russia Gibraltar<br />
Benin Guinea-Bissau Rwanda Heard Island and McDonald<br />
Islands<br />
Bhutan Guyana St. Kitts and Nevis Montserrat<br />
Bolivia Haiti Saint Lucia Niue<br />
Bosnia and<br />
Honduras<br />
Saint Vincent and the Norfolk Island<br />
Hercegovina<br />
Grenadines<br />
Botswana Hungary Samoa Pitcairn Islands<br />
Brazil India Sao Tomé and Principe Saint Helena<br />
Bulgaria Indonesia Senegal Tokelau<br />
Burkina Faso Jamaica Seychelles Turks and Caicos Islands<br />
Burundi Jordan Sierra Leone Virgin Islands, British<br />
Cambodia Kazakhstan Slovakia Wallis and Futuna<br />
Cameroon Kenya Solomon Islands West Bank and Gaza Strip<br />
Cape Verde Kiribati Somalia Western Sahara<br />
Central African Kyrgyzstan South Africa<br />
Republic<br />
Chad Latvia Sri Lanka<br />
Chile Lebanon Suriname<br />
Colombia Lesotho Swaziland<br />
Comoros Lithuania Tanzania<br />
Congo (Brazzaville) Macedonia, Former Thailand<br />
Yugoslav Republic<br />
Congo (Kinshasa) Madagascar Togo<br />
Costa Rica Malawi Tonga<br />
Côte d'Ivoire Mali Trinidad and Tobago<br />
Croatia Mauritania Tunisia<br />
Czech Republic Mauritius Turkey<br />
Djibouti Moldova Tuvalu<br />
Dominica Mongolia Uganda<br />
Dominican Republic Morocco Uruguay<br />
Ecuador Mozambique Uzbekistan<br />
Egypt Namibia Vanuatu<br />
El Salvador Nepal Venezuela<br />
Equatorial Guinea Niger Republic of Yemen<br />
Eritrea Nigeria Zambia<br />
124
APPENDIX 8<br />
LIST OF PROCESSES WHICH CAUSE HARM TO<br />
HEALTH AND SAFETY<br />
To give an idea of the health and safety risks, regarding the processing or handling material like:<br />
Wood:<br />
• Noise, for example when sawing timber, that can be reduced by wearing ear-protection<br />
(safety headphones) and cushioning of equipment are required when using motorised<br />
saws.<br />
• Dust, adequate suction underneath the saws and ventilation of the workplace is essential.<br />
Wetting the work floor can prevent whirling dust. Accumulated dust can be removed<br />
through hoovering (not sweeping!). Mouth filters and goggles are necessary to protect<br />
workers from wood dust.<br />
• Light (especially when working with motorised cutting equipment), sufficient lighting<br />
and protection from glare is required.<br />
• Safety of machinery and equipment, sawing and cutting requires special attention to hand<br />
safety.<br />
• Direct contact with dangerous substances (such as exhaust gases, timber dust and toxic<br />
chemicals), measures to protect the respiratory system and the eyes are required;<br />
accumulated timber dust should be removed and filters replaced regularly.<br />
• Toxic vapours from additives such as wood preservatives, emissions shall be minimised,<br />
air quality should be monitored periodically.<br />
Metal:<br />
• Dust, in foundries, one of the greatest risks to health is the exposure to dust, which can<br />
cause respiratory problems and damage the lungs and other vital organs. In the short<br />
term, respiratory illness can mean severe discomfort, with consequent loss of<br />
productivity, disruption and other overheads. Long-term effects are more serious.<br />
• Gases, vapours and other contaminants, the air in foundries may contain the potential<br />
irritants formaldehyde, furfuryl alcohol, isocyanates, various amines and phenol. These<br />
contaminants are generated primarily by the core making and moulding processes, and<br />
may irritate the eyes and the respiratory tract.<br />
• Heat and heat stress, radiant heat is the major contributor to the heat load imposed on the<br />
worker.<br />
• Physical injuries, serious burns may result from splashes of molten in the melting and<br />
pouring areas of foundries.<br />
Ceramics:<br />
• Dust; during the dry grinding of raw materials for the production of ceramics, dust may<br />
form.<br />
• Adequate ventilation and dust removal is required for this reason, Mouth filters and<br />
goggles are necessary to protect workers from dust.<br />
• Exposure to chemicals, glazing should only be performed in closed sites (automatically)<br />
or in well-ventilated areas (spray-cabins), Protective masks should be worn by people<br />
working with the glazes.<br />
Plastics:<br />
• Direct contact with (hazardous) chemicals, including the inhalation of solvents, toxic<br />
vapours and dusts. People working with chemicals should use protective clothing.<br />
• Safety of machinery and equipment, including exposure to noise and vibrations should be<br />
avoided.<br />
125