

one big file - Social Watch
one big file - Social Watch
one big file - Social Watch

Create successful ePaper yourself
Turn your PDF publications into a flip-book with our unique Google optimized e-Paper software.
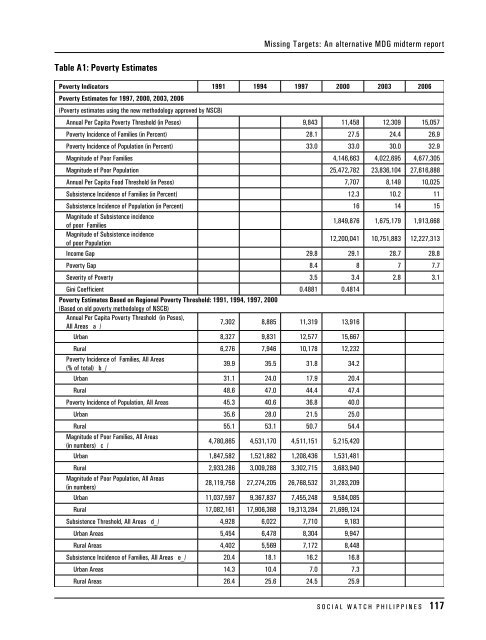
Missing Targets: An alternative MDG midterm report<br />
Table A1: Poverty Estimates<br />
Poverty Indicators 1991 1994 1997 2000 2003 2006<br />
Poverty Estimates for 1997, 2000, 2003, 2006<br />
(Poverty estimates using the new methodology approved by NSCB)<br />
Annual Per Capita Poverty Threshold (in Pesos) 9,843 11,458 12,309 15,057<br />
Poverty Incidence of Families (in Percent) 28.1 27.5 24.4 26.9<br />
Poverty Incidence of Population (in Percent) 33.0 33.0 30.0 32.9<br />
Magnitude of Poor Families 4,146,663 4,022,695 4,677,305<br />
Magnitude of Poor Population 25,472,782 23,836,104 27,616,888<br />
Annual Per Capita Food Threshold (in Pesos) 7,707 8,149 10,025<br />
Subsistence Incidence of Families (in Percent) 12.3 10.2 11<br />
Subsistence Incidence of Population (in Percent) 16 14 15<br />
Magnitude of Subsistence incidence<br />
of poor Families<br />
1,849,876 1,675,179 1,913,668<br />
Magnitude of Subsistence incidence<br />
of poor Population<br />
12,200,041 10,751,883 12,227,313<br />
Income Gap 29.8 29.1 28.7 28.8<br />
Poverty Gap 8.4 8 7 7.7<br />
Severity of Poverty 3.5 3.4 2.8 3.1<br />
Gini Coefficient 0.4881 0.4814<br />
Poverty Estimates Based on Regional Poverty Threshold: 1991, 1994, 1997, 2000<br />
(Based on old poverty methodology of NSCB)<br />
Annual Per Capita Poverty Threshold (in Pesos),<br />
All Areas a_/<br />
7,302 8,885 11,319 13,916<br />
Urban 8,327 9,831 12,577 15,667<br />
Rural 6,276 7,946 10,178 12,232<br />
Poverty Incidence of Families, All Areas<br />
(% of total) b_/<br />
39.9 35.5 31.8 34.2<br />
Urban 31.1 24.0 17.9 20.4<br />
Rural 48.6 47.0 44.4 47.4<br />
Poverty Incidence of Population, All Areas 45.3 40.6 36.8 40.0<br />
Urban 35.6 28.0 21.5 25.0<br />
Rural 55.1 53.1 50.7 54.4<br />
Magnitude of Poor Families, All Areas<br />
(in numbers) c_/<br />
4,780,865 4,531,170 4,511,151 5,215,420<br />
Urban 1,847,582 1,521,882 1,208,436 1,531,481<br />
Rural 2,933,286 3,009,288 3,302,715 3,683,940<br />
Magnitude of Poor Population, All Areas<br />
(in numbers)<br />
28,119,758 27,274,205 26,768,532 31,283,209<br />
Urban 11,037,597 9,367,837 7,455,248 9,584,085<br />
Rural 17,082,161 17,906,368 19,313,284 21,699,124<br />
Subsistence Threshold, All Areas d_/ 4,928 6,022 7,710 9,183<br />
Urban Areas 5,454 6,478 8,304 9,947<br />
Rural Areas 4,402 5,569 7,172 8,448<br />
Subsistence Incidence of Families, All Areas e_/ 20.4 18.1 16.2 16.8<br />
Urban Areas 14.3 10.4 7.0 7.3<br />
Rural Areas 26.4 25.6 24.5 25.9<br />
S O C I A L W A T C H P H I L I P P I N E S 117


