

one big file - Social Watch
one big file - Social Watch
one big file - Social Watch

Create successful ePaper yourself
Turn your PDF publications into a flip-book with our unique Google optimized e-Paper software.
Missing Targets: An alternative MDG midterm report<br />
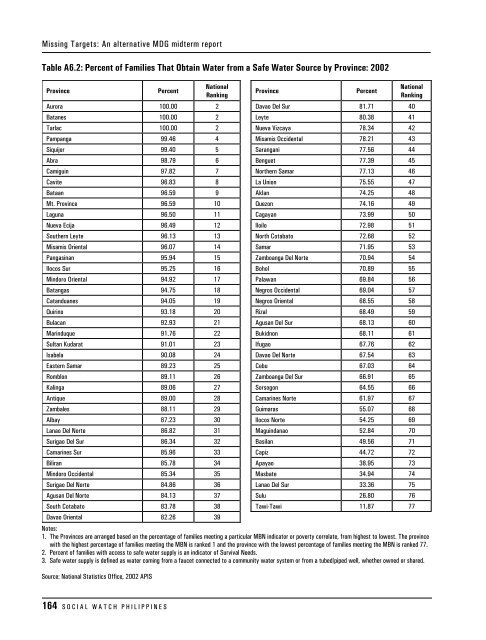
Table A6.2: Percent of Families That Obtain Water from a Safe Water Source by Province: 2002<br />
Province<br />
Percent<br />
National<br />
Ranking<br />
Province<br />
Percent<br />
Aurora 100.00 2 Davao Del Sur 81.71 40<br />
Batanes 100.00 2 Leyte 80.38 41<br />
Tarlac 100.00 2 Nueva Vizcaya 78.34 42<br />
Pampanga 99.46 4 Misamis Occidental 78.21 43<br />
Siquijor 99.40 5 Sarangani 77.56 44<br />
Abra 98.79 6 Benguet 77.39 45<br />
Camiguin 97.82 7 Northern Samar 77.13 46<br />
Cavite 96.83 8 La Union 75.55 47<br />
Bataan 96.59 9 Aklan 74.25 48<br />
Mt. Province 96.59 10 Quezon 74.16 49<br />
Laguna 96.50 11 Cagayan 73.99 50<br />
Nueva Ecija 96.49 12 Iloilo 72.98 51<br />
Southern Leyte 96.13 13 North Cotabato 72.68 52<br />
Misamis Oriental 96.07 14 Samar 71.95 53<br />
Pangasinan 95.94 15 Zamboanga Del Norte 70.94 54<br />
Ilocos Sur 95.25 16 Bohol 70.89 55<br />
Mindoro Oriental 94.92 17 Palawan 69.84 56<br />
Batangas 94.75 18 Negros Occidental 69.04 57<br />
Catanduanes 94.05 19 Negros Oriental 68.55 58<br />
Quirino 93.18 20 Rizal 68.49 59<br />
Bulacan 92.93 21 Agusan Del Sur 68.13 60<br />
Marinduque 91.76 22 Bukidnon 68.11 61<br />
Sultan Kudarat 91.01 23 Ifugao 67.76 62<br />
Isabela 90.08 24 Davao Del Norte 67.54 63<br />
Eastern Samar 89.23 25 Cebu 67.03 64<br />
Romblon 89.11 26 Zamboanga Del Sur 66.91 65<br />
Kalinga 89.06 27 Sorsogon 64.55 66<br />
Antique 89.00 28 Camarines Norte 61.97 67<br />
Zambales 88.11 29 Guimaras 55.07 68<br />
Albay 87.23 30 Ilocos Norte 54.25 69<br />
Lanao Del Norte 86.82 31 Maguindanao 52.84 70<br />
Surigao Del Sur 86.34 32 Basilan 49.56 71<br />
Camarines Sur 85.96 33 Capiz 44.72 72<br />
Biliran 85.78 34 Apayao 38.95 73<br />
Mindoro Occidental 85.34 35 Masbate 34.94 74<br />
Surigao Del Norte 84.86 36 Lanao Del Sur 33.36 75<br />
Agusan Del Norte 84.13 37 Sulu 26.80 76<br />
South Cotabato 83.78 38 Tawi-Tawi 11.87 77<br />
Davao Oriental 82.26 39<br />
National<br />
Ranking<br />
Notes:<br />
1. The Provinces are arranged based on the percentage of families meeting a particular MBN indicator or poverty correlate, from highest to lowest. The province<br />
with the highest percentage of families meeting the MBN is ranked 1 and the province with the lowest percentage of families meeting the MBN is ranked 77.<br />
2. Percent of families with access to safe water supply is an indicator of Survival Needs.<br />
3. Safe water supply is defined as water coming from a faucet connected to a community water system or from a tubed/piped well, whether owned or shared.<br />
Source: National Statistics Office, 2002 APIS<br />
164 S O C I A L W A T C H P H I L I P P I N E S


