

one big file - Social Watch
one big file - Social Watch
one big file - Social Watch

Create successful ePaper yourself
Turn your PDF publications into a flip-book with our unique Google optimized e-Paper software.
Missing Targets: An alternative MDG midterm report<br />
Present-day Ifugao province’s story, however,<br />
began with the establishment in 1889 of the Commandancia<br />
Politico-Militar de Quingan by the<br />
Spanish colonial government as a means of subduing<br />
the Ifugaos and placing them under Spanish rule.<br />
During the American colonial period, Ifugao was a<br />
subprovince of Nueva Vizcaya from 1902 until 1905<br />
before being integrated as yet another subprovince in<br />
1906 of the newly-created Mt. Province. On June 18,<br />
1966, Ifugao finally became a province by virtue of<br />
Republic Act 4695 which is known as the “Division<br />
Law of Mt. Province.” 3<br />
Ifugao remained until 2003 to be <strong>one</strong> of the<br />
Philippines’ poorest provinces, the poorest in Northern<br />
Luzon, and the poorest among the four Luzon provinces<br />
(after Camarines Norte, Occidental Mindoro<br />
and Marinduque) in the list of the top 15 poorest<br />
provinces. 4<br />
As such, it becomes a logical and automatic priority<br />
for MDG-related projects.<br />
Ifugao as once the poorest province of the<br />
Northern Luzon area will be the case in point for<br />
this review. The methodology will be simple: review<br />
what has changed between 2000 and 2007,<br />
evaluate key efforts from both the national and<br />
local governments, look at civil society initiatives,<br />
and formulate conclusions and recommendations.<br />
Local data will be mostly referred to in order to help<br />
pinpoint the realities that are often glossed over by<br />
national statistics.<br />
Assessment of status and progress<br />
Poverty and hunger<br />
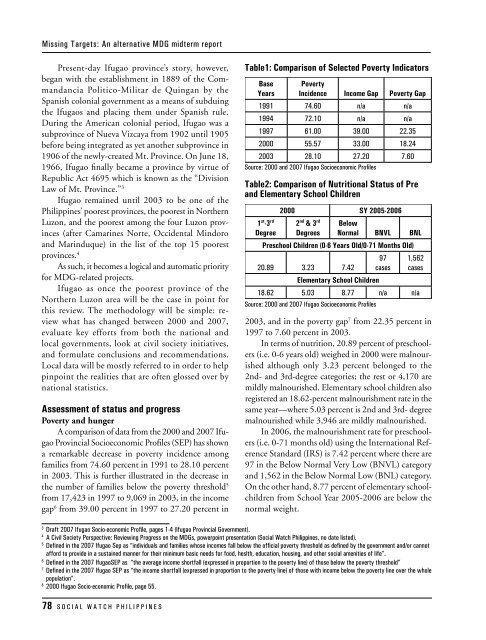
A comparison of data from the 2000 and 2007 Ifugao<br />
Provincial Socioeconomic Pro<strong>file</strong>s (SEP) has shown<br />
a remarkable decrease in poverty incidence among<br />
families from 74.60 percent in 1991 to 28.10 percent<br />
in 2003. This is further illustrated in the decrease in<br />
the number of families below the poverty threshold 5<br />
from 17,423 in 1997 to 9,069 in 2003, in the income<br />
gap 6 from 39.00 percent in 1997 to 27.20 percent in<br />
Table1: Comparison of Selected Poverty Indicators<br />
Base<br />
Years<br />
Poverty<br />
Incidence Income Gap Poverty Gap<br />
1991 74.60 n/a n/a<br />
1994 72.10 n/a n/a<br />
1997 61.00 39.00 22.35<br />
2000 55.57 33.00 18.24<br />
2003 28.10 27.20 7.60<br />
Source: 2000 and 2007 Ifugao Socioeconomic Pro<strong>file</strong>s<br />
Table2: Comparison of Nutritional Status of Pre<br />
and Elementary School Children<br />
1 st -3 rd<br />
Degree<br />
2000 SY 2005-2006<br />
2 nd & 3 rd<br />
Degrees<br />
Below<br />
Normal BNVL BNL<br />
Preschool Children (0-6 Years Old/0-71 Months Old)<br />
97 1,562<br />
20.89 3.23 7.42 cases cases<br />
Elementary School Children<br />
18.62 5.03 8.77 n/a n/a<br />
Source: 2000 and 2007 Ifugao Socioeconomic Pro<strong>file</strong>s<br />
2003, and in the poverty gap 7 from 22.35 percent in<br />
1997 to 7.60 percent in 2003.<br />
In terms of nutrition, 20.89 percent of preschoolers<br />
(i.e. 0-6 years old) weighed in 2000 were malnourished<br />
although only 3.23 percent belonged to the<br />
2nd- and 3rd-degree categories; the rest or 4,170 are<br />
mildly malnourished. Elementary school children also<br />
registered an 18.62-percent malnourishment rate in the<br />
same year—where 5.03 percent is 2nd and 3rd- degree<br />
malnourished while 3,946 are mildly malnourished.<br />
In 2006, the malnourishment rate for preschoolers<br />
(i.e. 0-71 months old) using the International Reference<br />
Standard (IRS) is 7.42 percent where there are<br />
97 in the Below Normal Very Low (BNVL) category<br />
and 1,562 in the Below Normal Low (BNL) category.<br />
On the other hand, 8.77 percent of elementary schoolchildren<br />
from School Year 2005-2006 are below the<br />
normal weight.<br />
3<br />
Draft 2007 Ifugao Socio-economic Pro<strong>file</strong>, pages 1-4 (Ifugao Provincial Government).<br />
4<br />
A Civil Society Perspective: Reviewing Progress on the MDGs, powerpoint presentation (<strong>Social</strong> <strong>Watch</strong> Philippines, no date listed).<br />
5<br />
Defined in the 2007 Ifugao Sep as “individuals and families whose incomes fall below the official poverty threshold as defined by the government and/or cannot<br />
afford to provide in a sustained manner for their minimum basic needs for food, heslth, education, housing, and other social amenities of life”.<br />
6<br />
Defined in the 2007 IfugaoSEP as “the average income shortfall (expressed in proportion to the poverty line) of those below the poverty threshold”<br />
7<br />
Defined in the 2007 Ifugao SEP as “the income shortfall (expressed in proportion to the poverty line) of those with income below the poverty line over the whole<br />
population”.<br />
8<br />
2000 Ifugao Socio-economic Pro<strong>file</strong>, page 55.<br />
78 S O C I A L W A T C H P H I L I P P I N E S


